When you connect to a Smart View query (specifically a function grid—a series of cells that contain cell functions), in Microsoft Excel or Word (imported Financial Reporting report), Disclosure Management imports all concepts automatically. Metadata (data source members) in the query—which has concepts mapped at the data source level, is also imported. Consequently, all that Smart View query requires are the context, units and footnote mapping performed in the same manner as report level mapping.
The benefit of importing as a function grid is that Function grids display query results in a dynamic grid format, in which the characteristics of each cell is displayed when you place the cursor over each cell. You can use Excel formulas, such as the SUM function with function grids.
Note: | To retain a formula as part of the function grid when you refresh function grid data, you must leave one empty row between the grid and the cell containing the formula. Remember to include the empty row in the range of cells selected for the formula definition. |
 To import a Financial Reporting report as a function grid in Smart View:
Connect to an Oracle Hyperion Enterprise Performance Management Workspace data source.
In the Smart View pane, navigate to the Financial Reporting report.
Right-click the report and select Open.
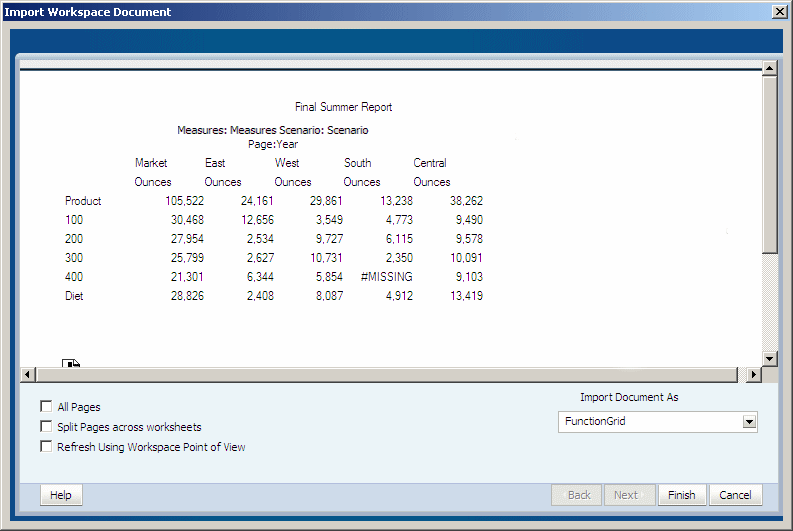
Select Split Pages across worksheets, to display each page on a separate Excel worksheet.
Select Refresh Using Workspace Point of View, to refresh the report using the EPM Workspace POV.
In the Import Document As, keep the default selection FunctionGrid.
In Excel, you may also import a report as a function grid, in addition to the existing fully-formatted and query ready import formats.
The function grid of the report is imported into Smart View.