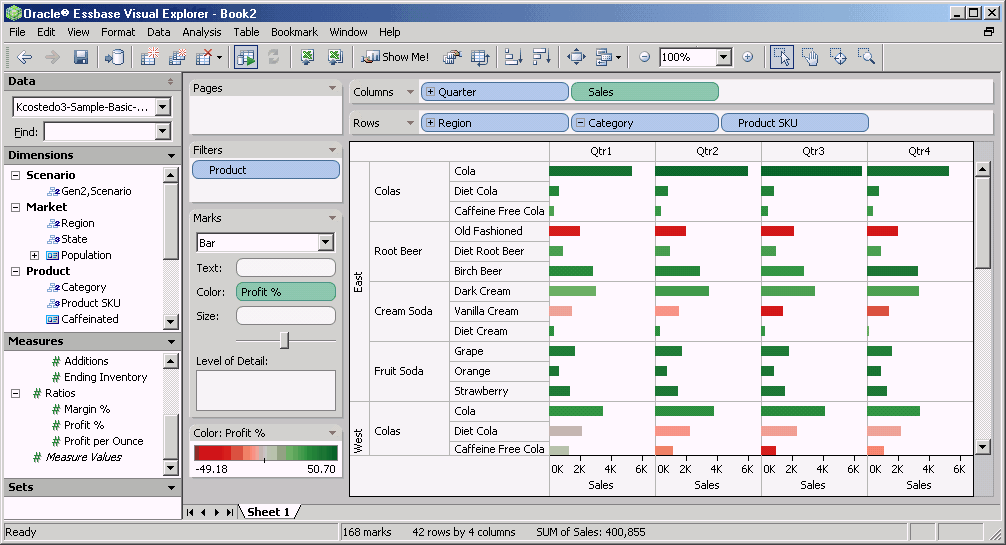
Visual Explorer provides Essbase users with powerful analytics in a highly graphical format. It enables users to unlock the information stored in multidimensional databases using a free-form canvas for exploring and analyzing data.
Visual Explorer is launched directly from the Essbase menu in Spreadsheet Add-in, using the Visualize & Explore command. Using the technique of dragging interface elements, Essbase users can quickly summarize and visualize data from an Essbase database. Visual Explorer offers users the option to pass data back to the Excel worksheet from which it was launched, or to insert the data into another Excel worksheet where additional analysis can be performed.
For detailed information on using Visual Explorer, see the online help that is accessed from the Help menu in Visual Explorer. |
This example uses Visual Explorer to identify quickly the most profitable product sales by quarter in the Sample Basic database.
 To use Visual Explorer to identify the most profitable product sales by quarter:
Drag Year from the Dimension section of the Data window and drop it on the Column shelf.
Drag Sales from the Measures section of the Data window and drop it on the Column shelf, placing it to the right of Quarter.
Drag Profit % from the Measures section of the Data window and drop it on the Color shelf.
At this point, you can see which quarter is the most profitable based on sales as indicated by the darkest color bar.
Drag Region from the Dimension section of the Data window and drop it on the Row shelf.
Drag Category from the Dimension section of the Data window and drop it on the Row shelf, placing it to the right of Region.
When you drag a generation to a shelf, all generations that are ancestors of the selected generation are automatically included in this placement. If you press the Control (Ctrl) key while dragging a generation to a shelf, only that generation is included in the placement.
To ignore the Diet Drinks alternate rollup in this analysis, right-click Category in the Row shelf and select Filter.
Diet Drinks is an alternate rollup containing shared members. You can deselect it from the query so that members that are shown are not redisplayed.
As shown by the dark green bars, Colas in the East is the most consistently profitable product based on sales.
You are now ready to pass the data from the visual worksheet into an Excel worksheet in Spreadsheet Add-in.
In Visual Explorer, select File, then Export, and then Cross-tab to Excel.
