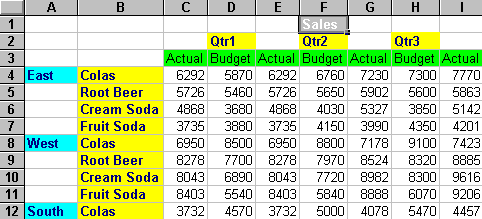
If you are an analyst in your company and want to know the difference between the actual and budgeted sales of beverages in all markets of each quarter in a certain year, you can easily determine this data using Essbase. In a multidimensional database, a data value is the intersection of all dimensions in the database. In a spreadsheet, a cell is the intersection of a row and column.
To translate the spreadsheet cell into a multidimensional data value, think of the multidimensional data as the intersection of one member from each of these dimensions displayed as rows and columns of a spreadsheet:
Each region of the Market dimension is displayed as a row in the spreadsheet. Spreadsheet Add-in displays each beverage product of the Product dimension as rows of the spreadsheet next to the rows containing the Market dimension.
The Time dimension, represented by each quarter, is displayed as columns of the spreadsheet. The Actual and Budget members of the Scenario dimension are also displayed in the columns of the spreadsheet. The cells of the intersection of the rows and columns in this spreadsheet represent the data values.
For example, the first data value in cell C4, 6292, represents the actual sales of colas for the East region in Qtr1. All values in the spreadsheet are sales values.
You can also rearrange the layout of the dimensions in the spreadsheet using pivot operations to interchange row dimensions as column dimensions and vice versa.
