@CORRELATION
Returns the correlation coefficient between two parallel data sets (expList1 and expList2). The correlation coefficient determines the relationship between two data sets.
Syntax
@CORRELATION (SKIPNONE | SKIPMISSING | SKIPZERO | SKIPBOTH, expList1, expList2)
| Parameter | Description |
|---|---|
SKIPNONE | Includes all cells specified in expList1 and expList2, regardless of their content, during calculation of the correlation coefficient. |
SKIPMISSING | Excludes all #MISSING values from expList1 and expList2 during calculation of the correlation coefficient. |
SKIPZERO | Excludes all zero (0) values from expList1 and expList2 during calculation of the correlation coefficient. |
SKIPBOTH | Excludes all zero (0) values and #MISSING values from expList1 and expList2 during calculation of the correlation coefficient. |
expList1 | The first list of member specifications, variable names, functions, or other numeric expressions. |
expList2 | The second list of member specifications, variable names, functions, or other numeric expressions. |
Notes
For complete information about using the @RANGE function, see @RANGE.
The expList1 and expList2 parameters must have the same number of data points. If expList1 and expList2 have different numbers of data points, @CORRELATION returns #MISSING.
The @CORRELATION function returns #MISSING if expList1 and expList2 (1) are empty, (2) contain only #MISSING values, or (3) have a standard deviation of 0 (all values are constant).
The @CORRELATION function treats #MISSING values as zero (0) values, unless SKIPMISSING or SKIPBOTH is specified. If a value in expList1 is #MISSING, and SKIPMISSING is specified, the value's corresponding value in expList2 is treated as #MISSING. (That is, both values are deleted before calculation.) SKIPZERO and SKIPBOTH work similarly.
The @CORRELATION function returns values from -1 to 1.
If you use a member set function to generate a member list for this function (for example, @SIBLINGS), to ensure correct results, consider the order in which Essbase sorts the generated member list. For more information, see the Oracle Essbase Technical Reference topic for the member set function you are using.
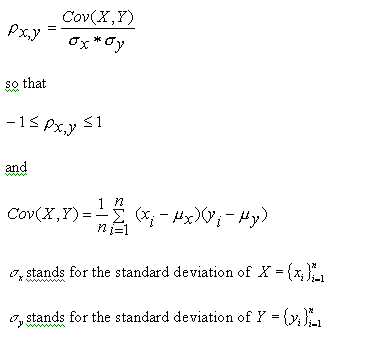
The equation for the correlation coefficient is:

Example
The following example is based on the Sample Basic database. Assume that the Measures dimension contains an additional member, Sales Correl. The calculation script calculates the correlation coefficient for a set of members (Sales for the children of Qtr1 and Qtr2). Because the calculation script fixes on Jun, the results are placed in Sales Correl->Jun.
This example uses the @RANGE function to generate expList1 and expList2:
FIX(June)
"Sales Correl"=@CORRELATION(SKIPNONE,
@RANGE(Sales,@CHILDREN(Qtr1)),@RANGE(Sales,@CHILDREN(Qtr2)));
ENDFIX
This example produces the following report:
             Colas     Actual    New York
               Sales       Sales Correl
               =====       ============
Jan             678             #MI
Feb             645             #MI
Mar             675             #MI
Apr             712             #MI
May             756             #MI
Jun             890        0.200368468
See Also