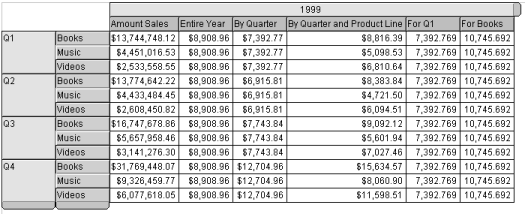
Calculated averages can be applied to break columns and break values. In this example, a variety of columns are created and display different average calculations based on the Amount_Sales column.
The following table shows how averages have been calculated in the figure above.
Table 143. Calculated Averages
Column | Numeric Function |
|---|
Amount Sales | sum of Amount Sales by quarter and Product Line = Sum (Amount_Sales) |
Entire Year | average purchase amount (Amount Sales) across all quarters and Product Lines = Avg (Amount_Sales) |
By Quarter | average purchase amount (Amount Sales) in a specific quarter = Avg (Amount_Sales, Quarter) |
For Quarter and Product Line | average purchase amount (Amount Sales) in a specific quarter for a Product line = Avg data function applied to Amount_Sales column |
For Q1 | average purchase size (Amount Sales) across all Product Lines for Q1 specifically = Avg (Amount_Sales, Quarter, 'Q1') |
For Books | average purchase size (Amount Sales) across all Quarters for Books = Avg (Amount_Sales, Product_Line, 'Books') |