Gauges

Gauges simulate familiar measuring devices, such as a speedometer or thermometer. They illustrate at a glance the performance relationships between actual and target values. Gauges can be embedded as stand-alone graphics, or made dynamic by association with a Slider. The Slider is a graphical control which drives the display of data by category in the gauge.
GaugeDescription
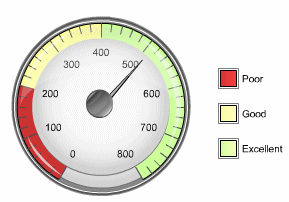
Image shows Speedo gauge
Speedometer—Features a speedometer like object. The radial design provides an easily to recognize mechanism for measuring values. The Speedometer gauge can be shown in 360 degree, 180 degree, 90 degree left or 90 degree formats.
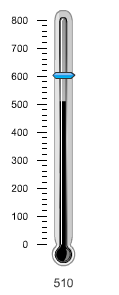
Image shows a Thermometer gauge.
Thermometer—Illustrates values in a thermometer like graphic. This Thermometer gauge is particularly useful for comparing levels based on a certain “temperature” level.
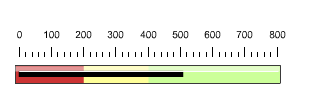
Image shows Bullet gauge
Bullet—Features a linear shape that is easily scalable to a smaller space in the dashboard.
Image shows a Traffic Light gauge.
Traffic Light—Illustrates the “safety” or health of a specific indicator in a single or multiple traffic light like graphic.