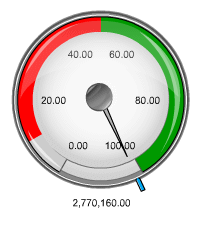
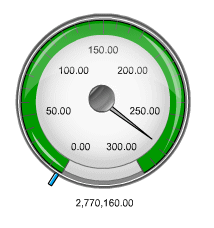
Color ranges are not rendered the same way for two identical gauges with approximate starting and ending values if one gauge has one or more blank color range buckets, and the other has all explicitly defined.
For example in the first sample, the numeric scale for the color ranges is defined at:
The result is:

In the second example, the numeric scale for the color ranges is defined at:
