Named cell ranges are generated to construct Excel formulas for computed items in the spreadsheet. For example, if there is a Table section with Break Totals, then the following types of named ranges are generated:
A continuous cell range that includes the whole column For example: Units = Results!$C$2:$C$998. This range can be used in all kinds of formula expressions, but cannot be passed to aggregate functions like SUM.
A compound or broken cell range that includes all the cells with actual data excluding those occupied by Total information For example: Units_Agg = Results!$C$2:$C$4,Results!$C$6:$C$34,Results!$C$36:$C$164. This range can be passed to aggregate functions, which is reflected in its the name.
A cell range used in break totals calculations For example: Sr_32_2=Results!$C$2:$C$4
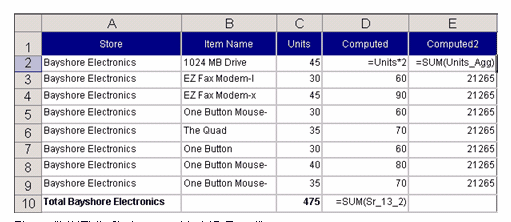
Below is a sample spreadsheet generated from the Results section. The column Computed of the section contained Units*2 expression, the column Computed2 contained SUM(Units) expression. The generated Excel formulas are shown in the cells.

For the Excel user, the Auto Outlining feature can be used to create row groups from the Break Totals that Interactive Reporting creates. Excel analyzes the formulas and creates the row groups and outline automatically. The user can then expand or collapse individual groups of rows.
Named cell ranges created in Interactive Reporting can be used for in-sheet formulas and in an external Excel file (worksheet linking). For example, an end user can create a new Excel file and enter a cell formula that refers to a data column of the workbook file exported from Interactive Reporting. For example, an end-user might enter: =SUM(BIExport.xls!Results_Units_Agg), where Results_Units_Agg is an auto-generated range that denotes the Units column of the Results table in the BIExport.xls file.