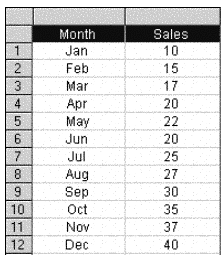
In a Simple Moving Average calculation, the original range of data values is split into smaller "windows" and a simple mean value of each window is calculated. An example of the calculation involved for such Simple Moving Averages is shown below.

If the first three Sales values were summed and then this sum was divided by 3 to give a mean value, this value would be:
(10 + 15 + 17) / 3 = 42 / 3 = 14
Next, consider the mean of the sum of the second, third and fourth original values i.e.:
(15 + 17 + 20) / 3 = 52 / 3 = 17.33
This pattern could be repeated to reveal the mean values of the third, fourth and fifth values; fifth, sixth and seventh values and so on until all subsequent windows of three numbers are summed and their mean values obtained.
The Simple Moving Averages of the original range of values for a window of 3 (i.e. in this case, a 3-Month Simple Moving Average) could be evaluated to be: