The scale for each report can be modified to reflect specific values. If you want to modify the values, they must be set on each individual report.
 To set scale values:
On the Oracle BI EE Home screen, select Dashboards, then OFMA, and then Oracle Financial Management Analytics.
Select the report that you want to modify, and then click Edit.
The Results tab is displayed.
On the Results tab tool bar, click the Edit View button in the Graph pane, and then click the Edit graph properties button

On the Graph Properties dialog box, select the Scale tab.
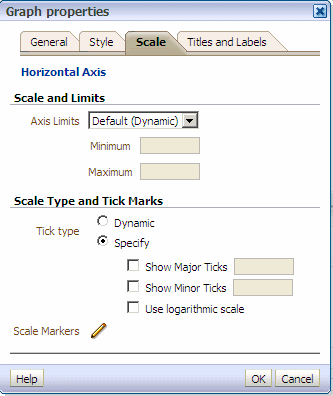
Under Scale and Limits, select the Axis Limits for the graph:
Select Default (Dynamic) to accept the default limits
Select Specify to set the limits, and then enter the Minimum and Maximum values for the limits.
Under Scale Type and Tick Marks, select the Tick Type for the graph:
Select Dynamic to accept the default settings
Select Specify to define the number of ticks to display, and then select the type to display, and enter the associated value:
Show Major ticks and specify the number of major ticks to show.
Show Minor ticks and specify the number of minor ticks to show.
Use logarithmic scale
Click OK to save the scale modifications for the selected report.
For additional information, see the Oracle Fusion Middleware User's Guide for Oracle Business Intelligence Enterprise Edition.