The schedule summary report contains high-level schedule summary details from Financial Close Management application.
The schedule summary report enables you to view the current status of all OPEN (running), and CLOSED schedule details and helps you to quickly understand the total number of Pending tasks, Closed tasks, and Open tasks within the schedule. The report calculates the percentage of actual completion and planned completion tasks.
 To compile the Schedule Summary report:
From the Oracle BI EE Global Header, select the Dashboards link, then select the OFMA menu list, and then select Oracle Financial Management Analytics.
From Oracle Financial Management Analytics, select the Close Schedule dashboard tab.
From POV Selector, select the required POV dimensions that you want to use for the dashboard, and then click Apply.
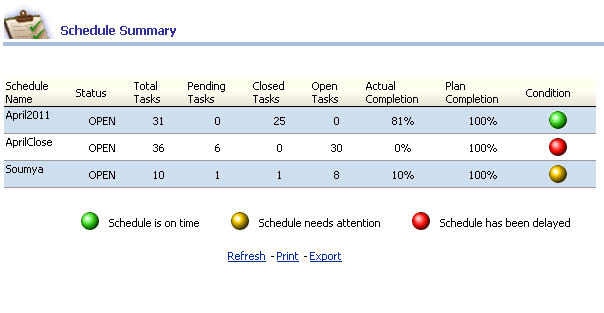
The report displays the following information:
Table 34. Schedule Summary – Report Details
| Column Details | Description |
|---|---|
| Schedule Name | Name of the schedule in the Financial Close Management Application |
| Status | The schedule status can be OPEN or CLOSED. |
| All Tasks | Total number of tasks within the schedule |
| Pending Tasks | Total number of pending tasks within the schedule |
| Closed Tasks | Total number of closed tasks within the schedule |
| Open Tasks | Total number of open tasks within the schedule |
| Actual Completion | The percentage of actual number of tasks completed against the total number of tasks for the schedule as on date |
| Plan Completion | The percentage of planned number of tasks completed per plan against the total number of tasks for the schedule as on date |
| Status Indicator | The indicator provides the schedule condition based on the timelines. |
Based on the following criteria, we calculate the delayed task within a schedule:
The scheduled end date of the task is less than current date
The task status in OPEN at the time of calculation
Tasks are considered based on the preceding criteria. The color code represents the state of the schedule based on timelines. For example:
 Green represents tasks progressing within expected timelines. By default, green indicates the schedule with a sum of delayed tasks less than or equal to 5.
 Yellow indicates that the schedule needs attention. By default, yellow indicates the schedule with a sum of delayed tasks greater than five and less than or equal to 10.
 Red indicates that the schedule has significant issues. By default, red indicates a schedule with a sum of delayed tasks greater than 10.
Note: | The color indicator and the threshold values defined can be modified only by the administrator. |