Drilling enables you to navigate through data within reports. You can drill into data in tables, pivot tables, graphs, and so on. The results displayed in the dashboard represent hierarchical data structures.
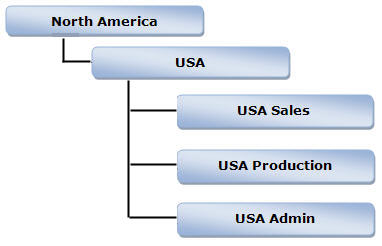
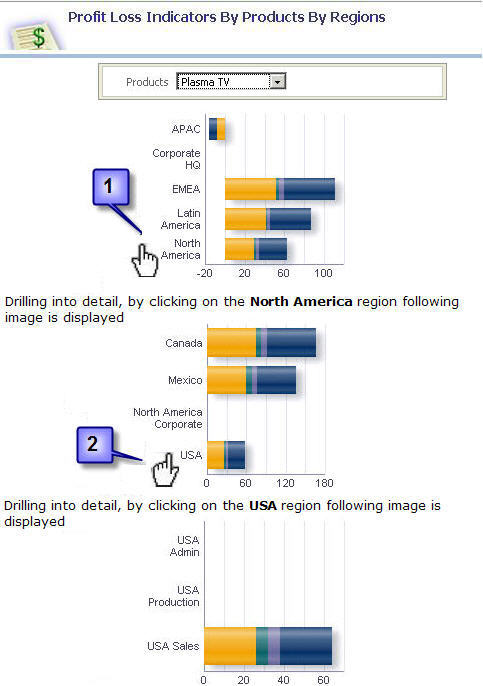
For example, under Executive Dashboard, the Profit Loss Indicators By Products By Regions report is categorized by region. Clicking North America displays each child entity within the hierarchy of the metadata.
To reset the dashboard to its original state, click the Reset Dashboard link in the POV selector section.