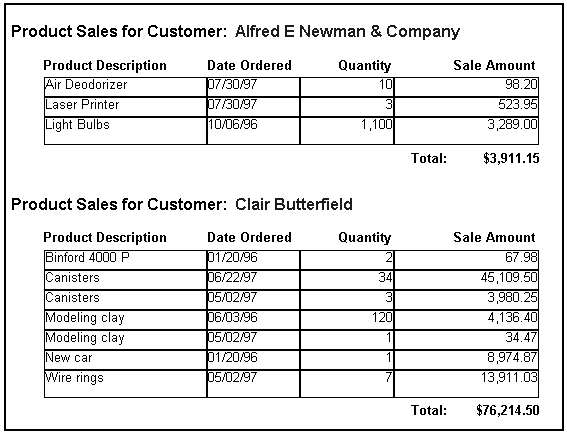
As you format HTML reports, you can add borders around objects in the report layout.
Along with text and background colors, borders can highlight columns or text objects. For example, in a report listing customer sales, you could draw a border around the total sale amount for each customer.
You can also use borders to display report details in a table or grid. For example, in the following report, we drew a border around the objects in the Details section of the report layout to display them in a table.

Format the border on the Cell property page for the selected object (see Cell Properties).
To access the Cell property page, double-click an object in the report layout, or right-click the object and select Object Properties.
 To format a border:
 on the Formatting Toolbar.