| Oracle® Fusion Middleware Administrator's Guide 11g Release 1 (11.1.1) Part Number E10105-14 |
|
|
PDF · Mobi · ePub |
| Oracle® Fusion Middleware Administrator's Guide 11g Release 1 (11.1.1) Part Number E10105-14 |
|
|
PDF · Mobi · ePub |
Oracle Fusion Middleware components generate log files containing messages that record all types of events, including startup and shutdown information, errors, warning messages, and access information on HTTP requests. This chapter describes how to find information about the cause of an error and its corrective action and to view and manage log files to assist in monitoring system activity and in diagnosing problems.
It contains the following topics:
Note:
For information about logging for IBM WebSphere, see "Configuring Oracle Fusion Middleware Logging on IBM WebSphere" in the Oracle Fusion Middleware Third-Party Application Server Guide.
Most Oracle Fusion Middleware components write diagnostic log files in the Oracle Diagnostic Logging (ODL) format. Log file naming and the format of the contents of log files conforms to an Oracle standard. By default, the diagnostic messages are written in text format.
ODL provides the following benefits:
The capability to limit the total amount of diagnostic information saved. You can set the level of information saved and you can specify the maximum size of the log file and the log file directory.
When you reach the specified size, older segment files are removed and newer segment files are saved in chronological fashion.
Components can remain active, and do not need to be shutdown, when older diagnostic logging files are deleted.
You can view log files using Fusion Middleware Control or the WLST displayLogs command, or you can download log files to your local client and view them using another tool (for example, a text editor or another file viewing utility).
Note:
Oracle WebLogic Server does not use the ODL format. For information about the Oracle WebLogic Server log format, see Oracle Fusion Middleware Configuring Log Files and Filtering Log Messages for Oracle WebLogic Server.
Using ODL, diagnostic messages are written to log files and each message includes information, such as the time, component ID, and user.
The following example shows an ODL format error messages from Oracle SOA Suite:
[2010-09-23T10:54:00.206-07:00] [soa_server1] [NOTIFICATION] [] [oracle.mds]
 [tid: [STANDBY].ExecuteThread: '1' for queue: 'weblogic.kernel.Default
 (self-tuning)'] [userId: <anonymous>] [ecid: 0000I3K7DCnAhKB5JZ4Eyf19wAgN000001,0]
 [APP: wsm-pm] "Metadata Services: Metadata archive (MAR) not found."
In the message, the fields map to the following attributes, which are described in Table 12-1:
Timestamp, originating: 2010-09-23T10:54:00.206-07:00
Organization ID: soa_server1
Message Type: NOTIFICATION
Component ID: oracle.mds
Thread ID: tid: [STANDBY].ExecuteThread: '1' for queue: 'weblogic.kernel.Default (self-tuning)'
User ID: userId: <anonymous>
Execution Context ID: ecid: 0000I3K7DCnAhKB5JZ4Eyf19wAgN000001,0
Supplemental Attribute: APP: wsm-pm
Message Text: "Metadata Services: Metadata archive (MAR) not found."
By default, the information is written to the log files in ODL text format. You can change the format to ODL XML format, as described in Section 12.4.4.
Table 12-1 describes the contents of an ODL message. For any given component, the optional attributes may not be present in the generated diagnostic messages.
Table 12-1 ODL Format Message Fields
| Attribute Name | Description | Required |
|---|---|---|
|
Timestamp, Originating (TIME) |
The date and time when the message was generated. This reflects the local time zone. |
Yes |
|
Timestamp, normalized (time_norm) |
The timestamp normalized for clock drift across hosts. This field is used when the diagnostic message is copied to a repository on a different host. |
No |
|
Organization ID (org_id) |
The organization ID for the originating component. |
No |
|
INSTANCE_ID |
The name of the Oracle instance to which the component that originated the message belongs. |
No |
|
COMPONENT ID (COMP_ID) |
The ID of the component that originated the message. |
Yes |
|
MESSAGE_ID (MSG_ID) |
The ID that uniquely identifies the message within the component. The ID consists of a prefix that represents the component, followed by a dash, then a 5-digit number. For example: OHS-51009 |
Yes |
|
MESSAGE_TYPE |
The type of message. Possible values are: INCIDENT_ERROR, ERROR, WARNING, NOTIFICATION, TRACE, and UNKNOWN. See Table 12-3 for information about the message types. |
Yes |
|
MESSAGE_LEVEL (MSG_LEVEL) |
The message level, represented by an integer value that qualifies the message type. Possible values are from 1 (highest severity) through 32 (lowest severity). See Table 12-3 for information about the message levels. |
Yes |
|
HOST_ID (HOST_ID) |
The name of the host where the message originated. |
No |
|
HOST_NW_ADDR (HOST_ADDR) |
The network address of the host where the message originated. |
No |
|
MODULE_ID (MODULE) |
The ID of the module that originated the message. If the component is a single module, the component ID is listed for this attribute. |
Yes |
|
PROCESS_ID (PID) |
The process ID for the process or execution unit associated with the message. |
No |
|
THREAD_ID (TID) |
The ID of the thread that generated the message. |
No |
|
USER_ID (USER) |
The name of the user whose execution context generated the message. |
No |
|
ECID |
The Execution Context ID (ECID), which is a global unique identifier of the execution of a particular request in which the originating component participates. You can use the ECID to correlate error messages from different components. See Section 12.5 for information about ECIDs. |
Yes |
|
RID |
The relationship ID (RID), which distinguishes the work done in one thread on one process, from work done by any other threads on this and other processes, on behalf of the same request. See Section 12.5 for information about RIDs. |
No |
|
SUPPL_ATTRS |
An additional list of name/value pairs which contain component-specific attributes about the event. Oracle Fusion Middleware provides the supplemental attribute DSID (Diagnostic Session ID). DSID is an ID for a user session and is used to map a set of log messages, incidents, and other diagnostic data to a user session. For example, you can see if a specific incident generated in a user session may have been proceeded by earlier incidents in the same session, and could therefore be the root cause of the subsequent incident. |
No |
|
MESSAGE TEXT (TEXT) |
The text of the message. |
Yes |
|
Message Arguments (arg) |
A list of arguments bound with the message text. |
No |
|
Supplemental Detail |
Supplemental information about the event, including more detailed information than the message text. |
No |
The log file location depends on the type of component:
For most Java components, the log file location is:
(UNIX) DOMAIN_HOME/servers/server_name/logs
(Windows) DOMAIN_HOME\servers\server_name\logs
The default name of a log file is server-name-diagnostic.log.
For system components, the default log file location is:
(UNIX) ORACLE_INSTANCE/diagnostics/logs
(Windows) ORACLE_INSTANCE\diagnostics\logs
Table 12-2 shows the log file location for components of Oracle Fusion Middleware.
In the table, DOMAIN_HOME refers to the domain home.
In the table, ORACLE_INSTANCE refers to the following directory, which is the Oracle instance home:
MW_HOME/instance_name
Table 12-2 Log File Location
| Component | Log File Location |
|---|---|
|
Fusion Middleware Control |
DOMAIN_HOME/sysman/log/emoms.log DOMAIN_HOME/sysman/log/emoms.trc |
|
Oracle Application Development Framework |
DOMAIN_HOME/servers/server_name/logs/server-name-diagnostic.log |
|
Oracle Business Activity Monitoring |
DOMAIN_HOME/servers/server_name/logs/bam-diagnostic.log |
|
Oracle Business Intelligence Discoverer |
DOMAIN_HOME/servers/server_name/logs/discoverer/server/diagnostic.log DOMAIN_HOME/servers/server_name/logs/discoverer/server_name-diagnostic.log DOMAIN_HOME/servers/server_name/logs/discoverer/diagnostic.log |
|
Oracle Business Process Management |
DOMAIN_HOME/servers/server_name/logs/server-name-diagnostic.log |
|
Oracle Directory Integration Platform |
DOMAIN_HOME/servers/server_name/logs/server-name-diagnostic.log |
|
Oracle Forms Services |
DOMAIN_HOME/servers/server_name/logs/server-name-diagnostic.log ORACLE_HOME/j2ee/DevSuite/application-deployments/forms/application.log ORACLE_INSTANCE/diagnostics/logs/FormsComponent/forms/* ORACLE_INSTANCE/diagnostics/logs/FRComponent/dejvm/* |
|
Oracle Fusion Middleware Audit Framework |
DOMAIN_HOME/servers/server_name/logs/server-name-diagnostic.log |
|
Oracle HTTP Server |
ORACLE_INSTANCE/diagnostics/logs/OHS/component_name/*.log |
|
Oracle Identity Federation |
DOMAIN_HOME/servers/server_name/logs/server-name-diagnostic.log |
|
Oracle WebCenter Content: Imaging |
DOMAIN_HOME/servers/server_name/logs/server-name-diagnostic.log |
|
Oracle Information Rights Management |
DOMAIN_HOME/servers/server_name/logs/server-name-diagnostic.log |
|
Oracle Internet Directory |
ORACLE_INSTANCE/diagnostics/logs/OID/component_name/oid*.log ORACLE_INSTANCE/diagnostics/logs/OID/tools/*.log |
|
Oracle Platform Security Services |
DOMAIN_HOME/servers/server_name/logs/server-name-diagnostic.log |
|
Oracle Portal |
DOMAIN_HOME/servers/server_name/logs/server-name-diagnostic.log ORACLE_INSTANCE/diagnostics/logs/portal |
|
Oracle Reports |
ORACLE_INSTANCE/diagnostics/logs/ReportsServerComponent/component_name/* ORACLE_INSTANCE/diagnostics/logs/ReportsBridgeComponent/component_name/* ORACLE_INSTANCE/diagnostics/logs/ReportsToolsComponent/component_name/* |
|
Oracle SOA Suite |
DOMAIN_HOME/servers/server_name/logs/server-name-diagnostic.log |
|
Oracle TopLink |
DOMAIN_HOME/servers/server_name/logs/server-name-diagnostic.log |
|
Oracle Virtual Directory |
ORACLE_INSTANCE/diagnostics/logs/OVD/component_name/diagnostic.log |
|
Oracle Web Cache |
ORACLE_INSTANCE/diagnostics/logs/WebCache/component_name*.log |
|
Oracle Web Services Manager |
DOMAIN_HOME/servers/server_name/logs/owsm/msglogging DOMAIN_HOME/servers/server_name/logs/owsm-diagnostic.log |
|
Oracle WebCenter Portal |
DOMAIN_HOME/servers/server_name/logs/server-name-diagnostic.log |
|
Oracle WebLogic Server |
DOMAIN_HOME/servers/server_name/logs/server-name-diagnostic.log |
|
Repository Creation Utility |
By default, writes to file specified in RCU_LOG_LOCATION. If not specified, attempts to write to the following locations:
|
You can view, list, and search log files across Oracle Fusion Middleware components. You can view and search log files using Fusion Middleware Control or you can download a log file to your local client and view the log files using another tool. You can also list, view, and search log files using the WLST command-line tool.
This section covers the following topics:
Note the following about using the WLST commands to view the log files:
To use the custom WLST logging commands, you must invoke the WLST script from the Oracle Common home. See Section 3.5.1.1 for more information.
The log viewing commands work whether you are connected or not connected to a WebLogic server. If you are not connected, you must specify the path in the oracleInstance parameter. You specify either the WebLogic domain home, or the Oracle instance.
Most of the WLST logging commands require that you are running in the domainRuntime tree. For example, to connect and to run in the domainRuntime tree, use the following WLST commands:
connect('username', 'password', 'localhost:port_number')
domainRuntime()
See Also:
"Logging Custom WLST Commands" in the Oracle Fusion Middleware WebLogic Scripting Tool Command Reference
You can view the log files using Fusion Middleware Control or WLST commands, as described in the following topics:
You can view the messages for all of the entities in a domain, an Oracle WebLogic Server, a component, or an application.
For example, to view the log files and their messages for a Managed Server:
From the navigation pane, expand the farm, then WebLogic Domain, and then the domain. Right-click the Managed Server name and choose Logs, then View Log Messages.
The Log Messages page is displayed.
Expand Selected Targets and in the row for a particular component or application, click Target Log Files.
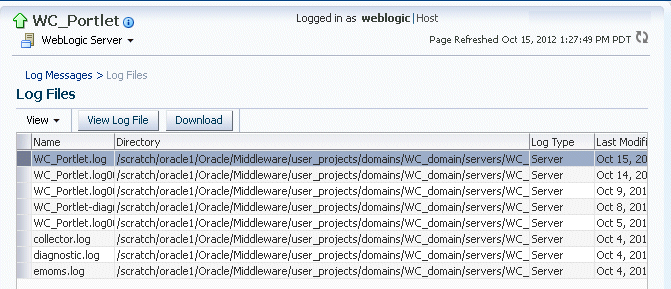
The Log Files page is displayed. On this page, you can see a list of log files related to the Managed Server, as shown in the following figure:
Select a file and click View Log File.
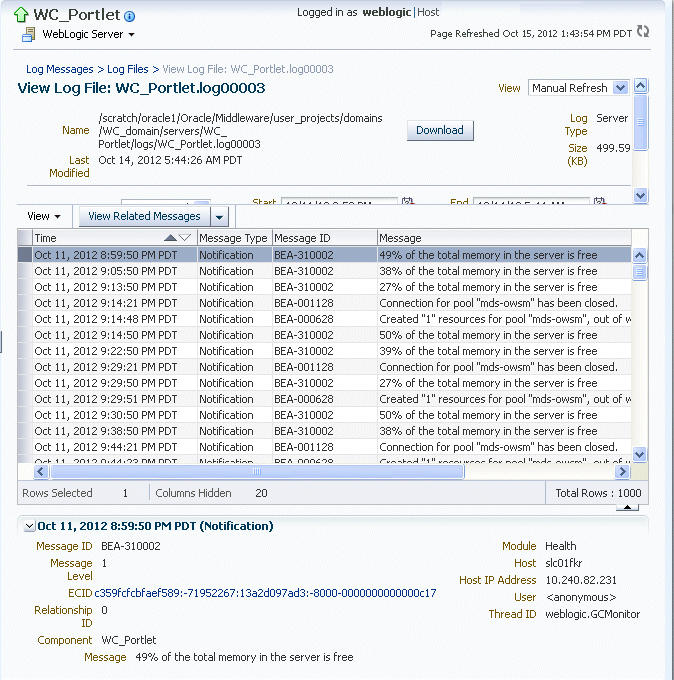
The View Log Files page is displayed. On this page, you can view the list of messages.
To view the details of a message, select the message.
The details are displayed in the pane below the listing, as shown in the following figure:
By default, the messages are sorted by time, in ascending order. You can sort the messages by the any of the columns, such as Message Type, by clicking the column name.
To view messages that are related by time or ECID, click View Related Messages and select by Time or by ECID (Execution Context ID).
The Related Messages page is displayed.
You can list the log files for an Oracle WebLogic Server domain, a server, an Oracle instance, or component using the WLST listLogs command.
You can use this command while connected or disconnected. While connected, the default target is the Oracle WebLogic Server domain.
To list the log files, first use the domainRuntime command as described in Section 12.3. The following describes how to list and view log files:
To list all of the log files for the Oracle WebLogic Server soa_server1, use the following command:
listLogs(target='server_soa')

file://host/scratch/Oracle/config/domains/SOA_domain/servers/soa_server1/logs/soa_server1.log
2010-09-17 16:40:45                    4.9M soa_server1.log00001
2010-09-17 18:35:35                    4.9M soa_server1.log00002
2010-09-17 20:30:25                    4.9M soa_server1.log00003
...
file://host/scratch/Oracle/config/domains/SOA_domain/servers/soa_server1/logs/soa_server1-diagnostic.log
2010-09-22 13:53:32                     10M soa_server1-diagnostic-22.log
2010-09-22 19:18:32                     10M soa_server1-diagnostic-23.log
2010-09-23 00:42:32                     10M soa_server1-diagnostic-24.log
2010-09-23 06:07:32                     10M soa_server1-diagnostic-25.log
2010-09-23 11:31:32                     10M soa_server1-diagnostic-26.log
2010-09-23 16:56:32                     10M soa_server1-diagnostic-27.log
2010-09-23 22:20:32                     10M soa_server1-diagnostic-28.log
2010-09-24 03:45:32                     10M soa_server1-diagnostic-29.log
2010-09-24 09:11:32                     10M soa_server1-diagnostic-30.log
2010-09-24 14:08:32                    9.2M soa_server1-diagnostic.log
...
To list the logs for the Oracle HTTP Server ohs1 in the Oracle instance asinst_1, use the following command:
listLogs(target='opmn:asinst_1/ohs1')
To list the logs while disconnected, you must specify the oracleInstance parameter, passing it the path of either the Oracle WebLogic Server domain or the Oracle instance home for the system component. For example, to list the log files for the Managed Server soa_server1:
listLogs(oracleInstance='/scratch/Oracle/config/domains/SOA_domain',
           target='soa_server1')
To view the diagnostic messages in log files, use the WLST displayLogs command. This command works when you are either connected or disconnected.
For example, to view the messages generated in the last 10 minutes in the log files for the Oracle WebLogic Server domain, use the following command:
displayLogs(last=10)

[2010-09-05T08:05:29.652-07:00] [soa_server1] [NOTIFICATION] [BEA-000628]
 [Common] [host: hostname] [nwaddr: 10.229.149.27] [tid:
 [ACTIVE].ExecuteThread: '10' for queue: 'weblogic.kernel.Default
 (self-tuning)'] [userId: <WLS Kernel>] [TARGET: /SOA_domain/soa_server1]
 [LOG_FILE: /scratch//Oracle/config/domains/SOA_
domain/servers/soa_server1/logs/soa_server1.log] Created "1" resources for
 pool "SOADataSource", out of which "1" are available and "0" are unavailable.
[2010-09-05T08:05:29.673-07:00] [soa_server1] [NOTIFICATION] [BEA-000628]
 [Common] [host: hostname] [nwaddr: 10.229.149.27] [tid: oracle.integration.platform.blocks.executor.WorkManagerExecutor$1@17f5105]
 [userId: <anonymous>] [TARGET: /SOA_domain/soa_server1] [LOG_FILE:
 /scratch/Oracle/config/domains/SOA
_domain/servers/soa_server1/logs/soa_server1.log] Created "1" resources for
 pool "SOADataSource", out of which "1" are available and "0" are unavailable.
[2010-09-05T08:05:30.448-07:00] [soa_server1] [NOTIFICATION] [BEA-001128]
 [JDBC] [host: hostname] [nwaddr: 10.229.149.27] [tid:
 oracle.integration.platform.blocks.executor.WorkManagerExecutor$1@17f5105]
 [userId: <anonymous>] [TARGET: /SOA_domain/soa_server1] [LOG_FILE:
 /scratch/Oracle/config/domains/SOA
_domain/servers/soa_server1/logs/soa_server1.log] Connection for pool
 "SOADataSource" closed.
The previous command returns the messages sorted by time, in ascending order.
To display the log files for the Oracle HTTP Server ohs1 in the Oracle instance asinst_1, use the following command:
displayLogs(target='opmn:asinst_1/ohs1')
You can search the messages by specifying particular criteria and sort the output, as described in Section 12.3.2.
See Also:
"Logging Custom WLST Commands" in the Oracle Fusion Middleware WebLogic Scripting Tool Command Reference for more information about the listLogs and displayLogs commands
You can search for diagnostic messages by time, type of message, and certain log file attributes by using Fusion Middleware Control or WLST commands, as described in the following topics:
You can search for diagnostic messages using standard and supplemental ODL attributes using the Log Messages page of Fusion Middleware Control. By default, this page shows a summary of the logged issues for the last hour.
You can modify the search criteria to identify messages of relevance. You can view the search results in different modes, allowing ease of navigation through large amounts of data.
The following sections describe how to search log files:
This section describes how to perform basic searches for log messages.
You can search for all of the messages for all of the entities in a domain, an Oracle WebLogic Server, a component, or an application.
For example, to search for messages for a domain:
From the WebLogic Domain menu, choose Logs, then View Log Messages.
To search for messages for a component or application, select the component or application. Then choose Logs, then View Log Messages from that target's menu.
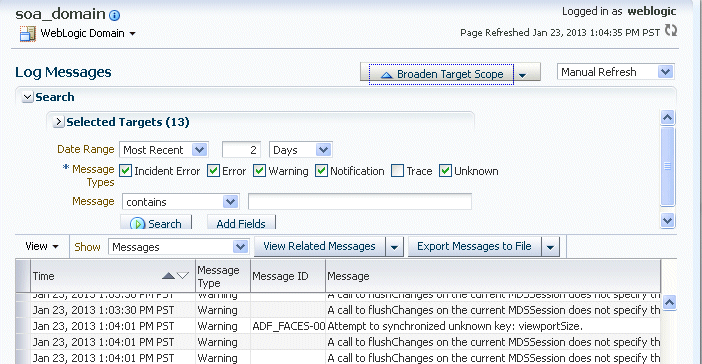
The Log Messages page displays a Search section and a table that shows a summary of the messages for the last hour, as shown in the following figure:
In the Date Range section, you can select either:
Most Recent: If you select this option, select a time, such as 3 hours. The default is 1 hour.
Time Interval: If you select this option, select the calendar icon for Start Date. Select a date and time. Then, select the calendar icon for End Date. Select a date and time.
In the Message Types section, select one or more of the message types. The types are described in Table 12-3.
You can specify more search criteria, as described in Section 12.3.2.1.2.
Click Search.
To help identify messages of relevance, in the table, for Show, select one of the following modes:
Messages: Shows the matching messages.
To see the details of a particular message, click the message. The details are displayed below the table of messages.
To view related messages, select a message, then click View Related Messages and select by Time or by ECID (Execution Context ID).
Group by Message Type: Summarizes the matching messages by grouping them based on message type at the target level. This is the default mode.
To see the messages, click the count in one of the message type columns. The Messages by Message Type page is displayed. To see the details of a particular message, click the message. The details are displayed below the table of messages.
Group by Message ID: Summarizes the matching messages by grouping them based on message ID, message type, and module IDs at the target level.
To see the associated messages, click the count in the Occurrences column. The Messages by Message ID page is displayed. To see the details of a particular message, click the message. The details are displayed below the table of messages.
This section describes some of the advanced search mechanisms you can use.
You can refine your search criteria using the following controls in the Log Messages page:
Message: You can select an operator, such as contains and then enter a value to be matched.
Add Fields: Click this to specify additional criteria, such as Host, which lets you narrow the search to particular hosts. Then click Add.
For each field you add, select an operator, such as contains and then enter a value to be matched.
Broaden Target Scope: Click this to expand the search to logs associated with all members of the parent of the target. For example, if you are searching an application's logs, you can expand the search to contain the Managed Server to which the application is deployed.
Selected Targets: Expand this to see the targets that are participating in the search. To add targets, click Add and provide information in the dialog box. To remove targets, select the target and click Remove.
You can search the log files using the WLST displayLogs command. You can narrow your search by specifying criteria, such as time, component ID, message type, or ECID. For example:
To search for error messages generated in the last 5 minutes, for the Oracle HTTP Server ohs1, use the following command:
displayLogs(target='opmn:asinst_1/ohs1', last=5)
To search for error messages generated in the last 10 minutes for the Managed Server soa_server1, use the following command:
displayLogs(oracleInstance='/scratch/Oracle/config/domains/soa_domain', target='soa_server1', last=10)
You can narrow your search by using the query parameter and specifying criteria, such as component ID, message type, or ECID. In the query clause, you can specify a query expression with any of the attributes listed in Table 12-1. Some of the criteria you can use are:
Types of messages. For example, to search for ERROR and INCIDENT_ERROR messages for the Managed Server soa_server1, use the following command:
displayLogs(oracleInstance='/scratch/Oracle/config/domains/soa_domain',
          target='soa_server1',
          query='MSG_TYPE eq ERROR or MSG_TYPE eq INCIDENT_ERROR')
A particular ECID. For example, to search for error messages with a particular ECID (0000I3K7DCnAhKB5JZ4Eyf19wAgN000001,0') for the Managed Server soa_server1, use the following command:
displayLogs(oracleInstance='/scratch/Oracle/config/domains/soa_domain',
         target='soa_server1',
         query='ecid eq 0000I3K7DCnAhKB5JZ4Eyf19wAgN000001,0')
Component type. For example, to search for messages from Oracle HTTP Server instances, use the following query:
displayLogs(query='COMPONENT_ID eq ohs')
Range of time. To search for error messages that occurred within a specified range of time, you specify the attribute TSTZ_ORIGINATING with both from and to operators, using the following format:
displayLogs(query='TSTZ_ORIGINATING from start_time and
                 TSTZ_ORIGINATING to end_time')
You specify the date using the following ISO 8601 time format:
YYYY-MM-DDThh:mm:ss-hh:mm_offset_from_UTC
For example:
2010-09-30T12:00:00:0000-08:00
For example, to display the error message from between 8:00 a.m. and 11 a.m. on April 17, 2010, use the following command:
displayLogs(query='TSTZ_ORIGINATING from 2010-04-17T08:00:00-07:00
            and TSTZ_ORIGINATING to 2010-04-17T11:00:00-07:00')
Group messages. To display a count of messages, grouped by specific attributes, use the groupBy parameter to the WLST command displayLogs. For example, to display the count of WARNING messages by component, use the following command:
displayLogs(groupBy=['COMPONENT_ID'], query='MSG_TYPE eq WARNING')
You can download messages using Fusion Middleware Control or WLST commands, as described in the following topics:
You can download the log messages to a file. You can download either the matching messages from a search or the messages in a particular log file.
To download the matching messages from a search to a file using Fusion Middleware Control:
From the navigation pane, expand the farm and select the target, for example by clicking on the domain.
From the dynamic target menu, such as the WebLogic Domain menu, choose Logs, then View Log Messages.
The Log Messages page is displayed.
Search for particular types of messages as described in Section 12.3.2.1.
Select a file type by clicking Export Messages to File and select one of the following:
As Oracle Diagnostic Log Text (.txt)
As Oracle Diagnostic Log Text (.xml)
As Comma-Separated List (.csv)
An Opening dialog box is displayed.
Select either Open With or Save to Disk. Click OK.
To export specific types of messages or messages with a particular Message ID to a file:
From the navigation pane, expand the farm, then WebLogic Domain, and then the domain. Select a Managed Server.
From the dynamic target menu, choose Logs, then View Log Messages.
The Log Messages page is displayed.
Search for particular types of messages as described in Section 12.3.2.1.
For Show, select Group by Message Type or Group by Message ID.
To download the messages into a file, if you selected Group by Message Type, select the link in one of the columns that lists the number of messages, such as the Errors column. If you selected Group by Message ID, select one of the links in the Occurrences column.
The Messages by Message Type page or Message by Message ID is displayed.
Select a file type by clicking the arrow near Export All to File.
You can select one of the following:
As Oracle Diagnostic Log Text (.txt)
As Oracle Diagnostic Log Text (.xml)
As Comma-Separated List (.csv)
An Opening dialog box is displayed.
Select either Open With or Save to Disk. Click OK.
To download the log files for a specific component using Fusion Middleware Control:
From the navigation pane, expand the farm. For system components, expand the installation type, such as Web Tier and select the component. For Java components, expand the farm, then the component type, and then select the component.
From the dynamic target menu, choose Logs, then View Log Messages.
The Log Messages page is displayed.
Click Target Log Files.
The Log Files page is displayed. On this page, you can see a list of log files related to the component or application.
Select a log file and click Download.
An Opening dialog box is displayed.
Select either Open With or Save to Disk. Click OK.
You can download log files using the WLST displayLogs command and redirecting the output to a file. For example:
displayLogs(type=['ERROR','INCIDENT_ERROR'], exportFile='/scratch/tmp/download_log.txt')
The messages are written to the file download_log.txt in the specified directory. By default, they are written to standard output.
You can change the log settings of Managed Servers and Java components using Fusion Middleware Control or WLST.
Note:
For many system components, which are listed in Section 3.5.2, you cannot configure settings for log files using Fusion Middleware Control. For information about how to configure options for log files for system components, see the Administrator's Guide for the component.
For Java components, you can configure the names and locations of log files, the size of the log files, the level of information written to the log files, the format, and the Locale encoding, as described in the following topics:
Note the following about using the WLST commands to configure log settings:
To use the custom WLST logging commands, you must invoke the WLST script from the Oracle Common home. See Section 3.5.1.1 for more information.
The configuration commands, such as setLogLevel, only work in connected mode. That is, you must connect to a running WebLogic Server instance before you invoke the commands.
The configuration commands are supported for Java components that run within a WebLogic Server, but are not supported for Oracle WebLogic Server. The configuration commands are not supported for system components.
Most of the WLST logging commands require that you are running in the domainRuntime tree. For example, to connect and to run in the domainRuntime tree, use the following commands:
connect('username', 'password', 'localhost:port_number')
domainRuntime()
The listLoggers, getLogLevel, and setLogLevel commands work in config and runtime mode. In config mode the commands work on loggers that are defined in the configuration file. In runtime mode, the commands work directly with loggers that are defined in the server JVM. By default, the setLogLevel command sets the level on the run-time logger and updates the logger definition in the configuration file. By default, the listLoggers and getLogLevel commands return run-time loggers.
See Also:
"Logging Custom WLST Commands" in the Oracle Fusion Middleware WebLogic Scripting Tool Command Reference
You can change the name and location of log files by using Fusion Middleware Control or WLST commands, as described in the following topics:
To change the name and location of a component log file using Fusion Middleware Control:
From the navigation pane, select the component.
From the dynamic target menu, choose Logs, then Log Configuration.
The Log Configuration page is displayed.
Note that the navigation may be different for some components. For example, for Oracle HTTP Server, you choose Administration, then Log Configuration.
Select the Log Files tab.
In the table, select the log handler and click Edit Configuration.
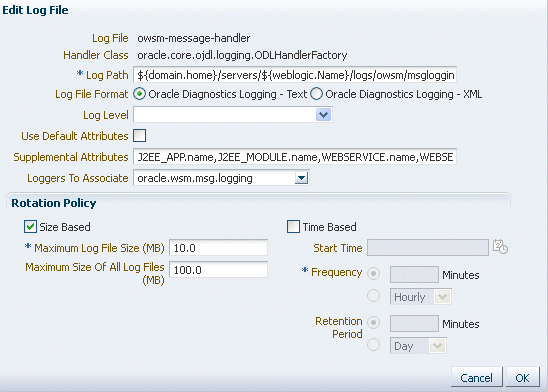
The Edit Log File dialog box is displayed, as shown in the following figure:
For Log Path, enter a new path.
Click OK.
In the confirmation window, click Close.
Note that if you change the location of Oracle HTTP Server log files, the location of the access_log and ohsn.log files are changed, but the location of console~OHS~1.log is not changed.
An ODL log is a set of log files that includes the current ODL log file and zero or more ODL Archives (segment files) that contain older messages. As the log file grows, new information is added to the end of the log file, server_name-diagnostic.log. When the log file reaches the rotation point, it is renamed and a new log file, server_name-diagnostic.log is created. You specify the rotation point, by specifying the maximum ODL segment size or the rotation time and rotation frequency.
Segment files are created when the ODL log file server_name-diagnostic.log reaches the rotation point. That is, the server_name-diagnostic.log is renamed to server_name-diagnostic-n.log, where n is an integer, and a new server_name-diagnostic.log file is created when the component generates new diagnostic messages.
To limit the size of the ODL log, you can specify:
The maximum size of the logging directory. Whenever the sum of the sizes of all of the files in the directory reaches the maximum, the oldest archive is deleted to keep the total size under the specified limit.
By default, the log files are rotated when they reach 10 MB. The maximum size of all log files for a particular component is 100 MB.
The maximum size of the log file. You specify that a new log file be created when a specific time or frequency is reached.
Note:
After you change the log file rotation, the configuration is reloaded dynamically. It may take 1 or 2 seconds to reload the configuration.
The following topics describe how to change the rotation:
To configure log file rotation using Fusion Middleware Control:
From the navigation pane, select the component.
From the dynamic target menu, choose Logs, then Log Configuration.
The Log Configuration page is displayed.
Note that the navigation may be different for some components. For example, for Oracle HTTP Server, you choose Administration, then Log Configuration.
Select the Log Files tab.
In the table, select the logger and click Edit Configuration.
The Edit Log File dialog box is displayed.
In the Rotation Policy section, you can select one of the following:
Size Based: If you select this, enter the following:
For Maximum Log File Size, enter the size in MB, for example, 15.
For Maximum Size of All Log Files, enter the size in MB, for example, 150.
Time Based: If you select this, enter the following:
For Start Time, click the calendar and select the date and time when you want the rotation to start. For example, select September 8, 2010 6:00 AM.
For Frequency, you can select Minutes and enter the number of minutes, or you can select Hourly, Daily, or Weekly.
For Retention Period, you can specify how long the log files are kept. You can select Minutes and enter the number of minutes, or you can specify Day, Week, Month, or Year.
Specifying a shorter period means that you use less disk space, but are not able to retrieve older information.
Click OK.
In the confirmation window, click Close.
To specify log file rotation using WLST, use the configureLogHandler command. You can specify size-based rotation or time-based rotation.
For example, to specify that the log files rotate daily and that they are retained for a week, use the following command:
configureLogHandler(name='odl-handler', rotationFrequency='daily',
                      retentionPeriod='week')
To specify that the size of a log file does not exceed 5 MB and rotates when it reaches that size, use the following command:
configureLogHandler(name='odl-handler', maxFileSize='5M')
You can configure the amount and type of information written to log files by specifying the message type and level. For each message type, possible values for the message level are from 1 (lowest severity) through 32 (highest severity). Some components support only some of the levels for each message type. See the Administration Guide for your component for more information. Generally, you need to specify only the type; you do not need to specify the level.
When you specify the type, Oracle Fusion Middleware returns all messages of that type, as well as the messages that have a higher severity. For example, if you set the message type to WARNING, Oracle Fusion Middleware also returns messages of type INCIDENT_ERROR and ERROR.
Table 12-3 describes the message types and the most common levels for each type.
Table 12-3 Diagnostic Message Types and Level
| Message Type | Level | Description |
|---|---|---|
|
1 |
A serious problem that may be caused by a bug in the product and that should be reported to Oracle Support. Examples are errors from which you cannot recover or serious problems. |
|
|
1 |
A serious problem that requires immediate attention from the administrator and is not caused by a bug in the product. An example is if Oracle Fusion Middleware cannot process a log file, but you can correct the problem by fixing the permissions on the document. |
|
|
1 |
A potential problem that should be reviewed by the administrator. Examples are invalid parameter values or a specified file does not exist. |
|
|
1 |
A major lifecycle event such as the activation or deactivation of a primary sub-component or feature. This is the default level for NOTIFICATION. |
|
|
NOTIFICATION |
16 |
A finer level of granularity for reporting normal events. |
|
1 |
Trace or debug information for events that are meaningful to administrators, such as public API entry or exit points. |
|
|
TRACE |
16 |
Detailed trace or debug information that can help Oracle Support diagnose problems with a particular subsystem. |
|
TRACE |
32 |
Very detailed trace or debug information that can help Oracle Support diagnose problems with a particular subsystem. |
The default is NOTIFICATION, level 1.
The INCIDENT_ERROR, ERROR, WARNING, and NOTIFICATION with level 1 have no performance impact. For other types and levels, note the following:
NOTIFICATION, with level 16: Minimal performance impact.
TRACE, with level 1: Small performance impact. You can enable this level occasionally on a production environment to debug problems.
TRACE, with level 16: High performance impact. This level should not be enabled on a production environment, except on special situations to debug problems.
TRACE, with level 32: Very high performance impact. This level should not be enabled in a production environment. It is intended to be used to debug the product on a test or development environment.
Table 12-4 shows the log level mappings among ODL format, Oracle WebLogic Server, and Java.
Table 12-4 Mapping of Log Levels Among ODL, Oracle WebLogic Server, and Java
| ODL | WebLogic Server | Java |
|---|---|---|
|
OFF |
OFF |
2147483647 - OFF |
|
INCIDENT_ERROR:1 |
(EMERGENCY) |
1100 |
|
INCIDENT_ERROR:4 |
EMERGENCY |
1090 |
|
INCIDENT_ERROR:14 |
ALERT |
1060 |
|
INCIDENT_ERROR:24 |
CRITICAL |
1030 |
|
ERROR:1 |
(ERROR) |
1000 - SEVERE |
|
ERROR:7 |
ERROR |
980 |
|
WARNING:1 |
WARNING |
900 - WARNING |
|
WARNING:7 |
NOTICE |
880 |
|
NOTIFICATION:1 |
INFO |
800 - INFO |
|
NOTIFICATION:16 |
(DEBUG) |
700 - CONFIG |
|
TRACE:1 |
(DEBUG) |
500 - FINE |
|
TRACE:1 |
DEBUG |
495 |
|
TRACE:16 |
(TRACE) |
400 - FINER |
|
TRACE:32 |
(TRACE) |
300 - FINEST |
|
TRACE:32 |
TRACE |
295 |
You can configure the message levels using Fusion Middleware Control or WLST commands, as described in the following topics:
You can set the message level for a particular log file or for loggers.
To set the message level for a component log file:
From the navigation pane, select the component.
From the dynamic target menu, choose Logs, then Log Configuration.
The Log Configuration page is displayed.
Note that the navigation may be different for some components. For example, for Oracle HTTP Server, you choose Administration, then Log Configuration.
Select the Log Files tab.
In the table, select the log file and click Edit Configuration.
The Edit Log File dialog box is displayed, as shown in the following figure:
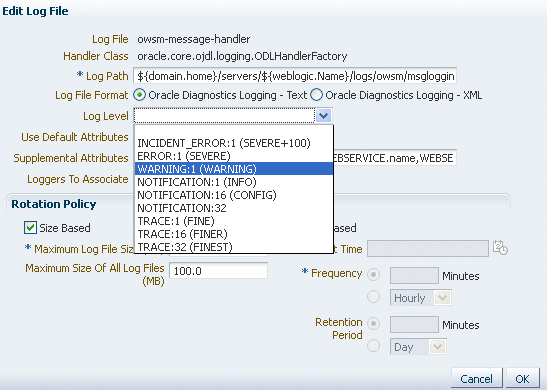
For Log Level, select the logging level. For example, select WARNING:1 (WARNING).
Click OK.
In the confirmation window, click Close.
To set the message level for one or more loggers for a component:
From the navigation pane, select the component.
From the dynamic target menu, choose Logs, then Log Configuration.
The Log Configuration page is displayed.
Note that the navigation may be different for some components. For example, for Oracle HTTP Server, you choose Administration, then Log Configuration.
Select the Log Levels tab.
For View, select Runtime Loggers or Loggers with Persistent Log Level State.
Run-time loggers are loggers that are currently active. Persistent loggers are loggers that are saved in a configuration file and the log levels of these loggers are persistent across component restarts. A run-time logger can also be a persistent logger, but not all run-time loggers are persistent loggers.
In the table, to specify the same level for all loggers, select the logging level for the top-level logger. Then, for child loggers that do not specify that the logging level is inherited from the parent, specify Inherited from Parent. For most situations, that is sufficient.
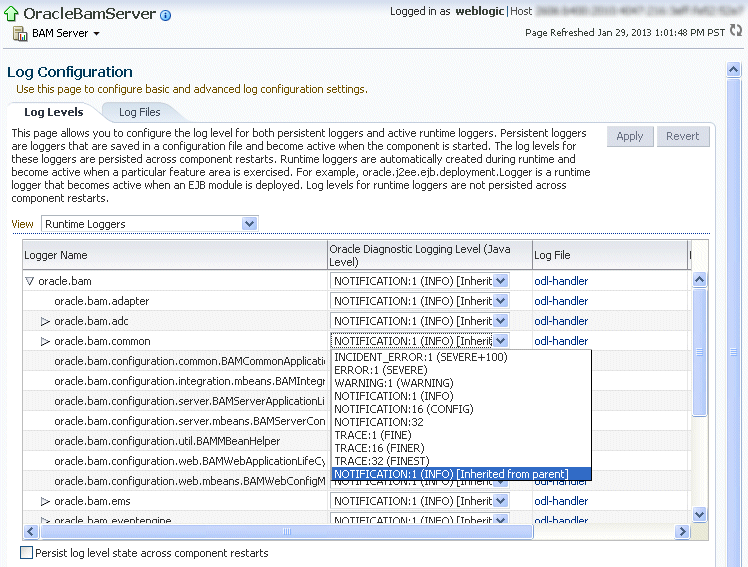
However, if you need to specify the level for a particular logger, expand the logger and then, for the logger that you want to modify, select the logging level. For example, for the logger oracle.wsm.management.logging, select WARNING:1 (WARNING).
Click Apply.
To set the message level with WLST, you use the setLoglevel command. To get the current message level, you use the getLogLevel command. You must be connected to WebLogic Server before you use the configuration commands.
You can view the log level for a logger for an Oracle WebLogic Server. For example, to view the log level of the Oracle WebLogic Server soa_server1, use the following command:
getLogLevel(logger='oracle',  target='soa_server1')
NOTIFICATION:1
You can set the log level for a particular logger. The following example sets the message type to WARNING for the logger oracle.soa:
setLogLevel(target='soa_server1', logger='oracle.soa', level='WARNING')
To get a list of loggers for the Oracle WebLogic Server soa_server1, use the listLoggers command:
listLoggers(target='soa_server1')
.
.
.
oracle.soa                               |  WARNING:1
oracle.soa.adapter                       | <Inherited>
orac                                     | <Inherited>
oracle.soa.b2b.apptransport              | <Inherited>
oracle.soa.b2b.engine                    | <Inherited>
oracle.soa.b2b.repository                | <Inherited>
oracle.soa.b2b.transport                 | <Inherited>
oracle.soa.b2b.ui                        | <Inherited>
.
.
.
You can also filter logger names using the pattern parameter and a regular expression. For example, to return all loggers that begin with oracle in the Oracle WebLogic Server soa_server1, use the following command:
listLoggers(target='soa_server1', pattern='oracle.*')
oracle                                   | NOTIFICATION:1
oracle.adapter                           | <Inherited>
oracle.adapter.jms.logger                | <Inherited>
oracle.adf                               | <Inherited>
By default, information is written to log files in ODL text format. You can change the format to ODL XML format using Fusion Middleware Control or WLST commands, as described in the following topics:
To change the format using Fusion Middleware Control:
From the navigation pane, select the component.
From the dynamic target menu, choose Logs, then Log Configuration.
The Log Configuration page is displayed.
Note that the navigation may be different for some components. For example, for Oracle HTTP Server, you choose Administration, then Log Configuration.
Select the Log Files tab.
In the table, select the log file and click Edit Configuration.
The Edit Log File dialog box is displayed.
For Log File Format, select Oracle Diagnostics Logging - Text or Oracle Diagnostics Logging - XML.
Click OK.
In the confirmation window, click Close.
To specify the log file format using WLST, you use the configureLogHandler command, with the format parameter and specify either ODL-Text or ODL-XML. ODL-Text is the default.
For example, to specify ODL-XML format, use the following command:
configureLogHandler(name='odl-handler', format='ODL-XML')
The language and data formats used in the log files are determined by the default locale of the server Java Virtual Machine (JVM). You can change them using the Language and Regional Options applet in Control Panel on Windows or the LANG and LC_ALL environment variables on a UNIX platform.
The character encoding of log files is determined by the server JVM's default character encoding or an optional configuration setting. You should choose an encoding that supports all languages used by the users, or the log file may be corrupted. By default, the log is in the server JVM's default character encoding. If you change the encoding, delete or rename old log files to prevent them from being damaged by the new logs appended in a different encoding.
For support of any language, Oracle recommends that you use Unicode UTF-8 encoding. On a UNIX operating system, setting the LANG and LC_All environment variables to a locale with the UTF-8 character set enables UTF-8 logging (for example, en_US.UTF-8 for the US locale in UTF-8 encoding).
You can specify the log file locale using WLST commands or by editing a file, as described in the following topics:
To specify the log file encoding using WLST, use the configureLogHandler command. You can use the encoding parameter to specify the character set encoding.
For example, to specify UTF-8, use the following command:
configureLogHandler(name="odl-handler", encoding="UTF-8")
To specify the log file encoding in the logging.xml file, use an optional encoding property to specify the character set encoding.
The logging.xml file is located in the following directory:
DOMAIN_HOME/config/fmwconfig/servers/server_name/
For example, to specify UTF-8, add the following encoding property in the log_handler element:
<property name='encoding' value='UTF-8'/>
Oracle Fusion Middleware components provide message correlation information for diagnostic messages. Message correlation information helps those viewing diagnostic messages to determine relationships between messages across components. Each diagnostic message contains an Execution Context ID (ECID) and a Relationship ID (RID):
An ECID is a globally unique identifier associated with the execution of a particular request. An ECID is generated when the request is first processed.
A RID distinguishes the work done in one thread on one process, from work done by any other threads on this and other processes on behalf of the same request.
The ECID and RID help you to use log file entries to correlate messages from one application or across Oracle Fusion Middleware components. By searching for related messages using the message correlation information, multiple messages can be examined and the component that first generates a problem can be identified (this technique is called first-fault component isolation). Message correlation data can help establish a clear path for a diagnostic message across components, within which errors and related behavior can be understood.
You can use the ECID and RID to track requests as they move through Oracle Fusion Middleware.
The following shows an example of an ECID:
0000I3K7DCnAhKB5JZ4Eyf19wAgN000001,0
The RID is one or more numbers separated by a colon (:). The first RID created for a request is 0. Each time work is passed from a thread that has an ECID associated with it to another thread or process, a new RID is generated that encodes the relationship to its creator. That is, a new generation is created. Each shift in generation is represented by a colon and another number. For example, the seventh child of the third child of the creator of the request is:
0:3:7
You can view all the messages with the same ECID using the WLST displayLogs command. The following example searches for the ECID in the domain:
displayLogs(ecid='0000Hl9TwKUCslT6uBi8UH18lkWX000002')
You can also search for the ECID in a WebLogic Server instance, or a system component, by specifying it in the target option.
You can search for messages with a particular ECID on the Log Messages page in Fusion Middleware Control:
From the WebLogic Domain menu, choose Logs, then View Log Messages.
To search for messages for a component or application, select the component or application and then choose Logs, then View Log Messages from that target's menu.
Specify search criteria, as described in Section 12.3.2.1.2.
Click Search.
Select a message, then click View Related Messages and select by ECID (Execution Context ID).
The messages with the same ECID are displayed, as shown in the following figure:
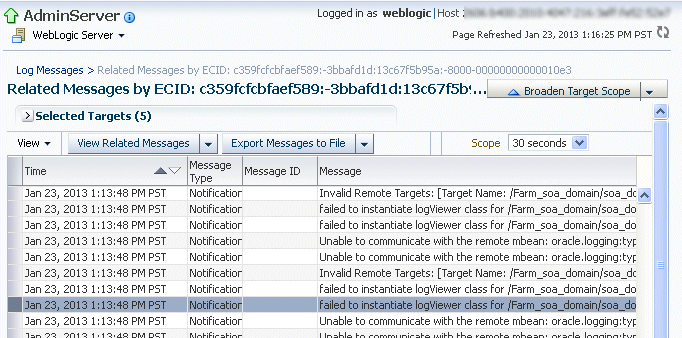
Trace the ECID to the earliest message. (You may need to increase the scope to view the first message with the ECID.)
Sometimes you need more information to troubleshoot a problem than it is usually recorded in the logs. One way to achieve that is to increase the level of messages logged by one or more components. For example, you can set the logging level to TRACE:1 or TRACE:32, as described in Section 12.4.3, which results in more detailed messages being written to the log files. This is referred to as tracing.
However, this can often result in a large amount of log messages being written to the log files. Oracle Fusion Middleware provides the following mechanisms to fine-tune which messages are traced:
QuickTrace, which provides fine-grained logging to memory
Selective Trace, which provides fine-grained logging for a specific user or other properties of a request
The following topics provide information about how to use these mechanisms:
With QuickTrace, you can trace messages from specific loggers and store the messages in memory. Because QuickTrace logs the messages to memory, it avoids the cost of formatting, string manipulations, and input/output operations. As as result, you can enable fine-level application logging for specific loggers without performance overhead.
By default, QuickTrace writes the messages to one common buffer. However, you can specify that messages for particular users are written to separate buffers.
You can save the messages that are in memory to a file by invoking the QuickTrace Dump in Fusion Middleware Control as described in Section 12.6.1.1.2 or by using the WLST, as described in Section 12.6.1.2.2.
To enable QuickTrace, you create a QuickTrace handler and associate a logger with it. You can specify the buffer size, as well as other attributes, for the handler. Then, you set the level of the amount and type of information to be written by the loggers to memory.
The following topics describe how to enable and use QuickTrace:
You can configure and use QuickTrace using Fusion Middleware Control, as described in the following topics:
To configure QuickTrace using Fusion Middleware Control:
From the navigation pane, expand the farm, then WebLogic Domain, and then the domain. Right-click the Managed Server name and choose Logs, then Log Configuration.
The Log Configuration page is displayed.
Select the QuickTrace tab.
Click Create.
The Create QuickTrace Handler dialog box is displayed, as shown in the following figure:
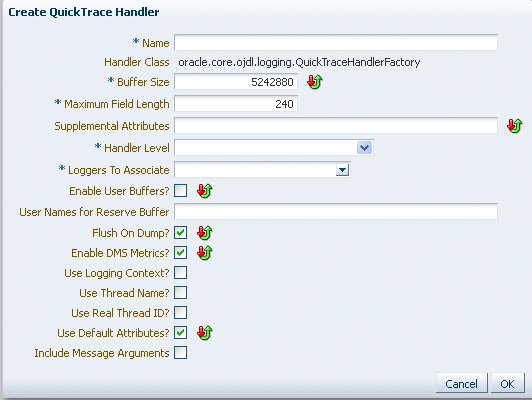
For Name, enter a name for the handler.
For Buffer Size, enter the size, in bytes, for the buffer for storing log messages in memory. The default is 5242880.
For Maximum Field Length, enter the length, in bytes, for each field in a message. The fields can include the message text, supplemental attributes, and the thread name. The default is 240.
An excessively long field for each message can reduce the amount of log records in the buffer.
For Handler Level, select the log level for the handler. See Section 12.4.3 for information about the levels.
For Loggers to Associate, select the loggers that you want to associate with this QuickTrace handler. All messages of the specified level for these handlers will be written to memory.
Many loggers are associated with other handlers. For example, the oracle.adf logger is associated with the handlers odl-handler, wls-domain, and console-handler. When you set the level of the logger, these handlers will use the same level, such as TRACE:1, for the logger, such as oracle.adf. As a result, much information will be written to the log files, consuming resources. To avoid consuming resources, set the level of the handlers to a lower level, such as WARNING or INFORMATION.
Select Enable User Buffer? if you want to enable a user buffer. If you enable this, the handler maintains an individual buffer for each user you specify.
Then, for User Names for Reserve Buffer, enter the names of the users, separated by commas.
For the remaining options, accept the default values. For information about the options, see "ConfigureLogHandler" in the Oracle Fusion Middleware WebLogic Scripting Tool Command Reference.
Click OK.
When the configuration completes processing, click OK.
Now, messages of the specified level for the specified loggers are written to memory.
You can save the messages that are in memory to a file by invoking the QuickTrace Dump in Fusion Middleware Control:
From the QuickTrace tab of the Log Configuration page, select the handler and click Invoke QuickTrace Dump.
The Invoke QuickTrace Dump dialog box is displayed.
For Buffer Name, if you have specified user buffers when you configured the QuickTrace handler, select the user, or select Common Buffer for users that you did not specify. If you did not specify any user buffers, the Common Buffer is the only option.
Click OK.
When the processing is complete, the View Log Messages page is displayed.
You can search the messages, as described in Section 12.3.2, and you can correlate the messages as described in Section 12.5.
In addition, you can download the messages to a file, as described in Section 12.3.3.1.
You can configure and use QuickTrace Using WLST, as described in the following topics:
To configure QuickTrace using WLST, you associate a logger with the QuickTrace handler, using the configureLogHandler command.
For example, to associate the oracle.adf logger with the QuickTrace handler and write all TRACE:1 messages to memory:
Use the configureLogHandler command to associate the logger with the QuickTrace handler:
configureLogHandler(name="quicktrace-handler", addToLogger="oracle.adf")

Handler Name: quicktrace-handler
type:   oracle.core.ojdl.logging.QuickraceHandlerFactory
useLoggingContext:      false
bufferSize:     5242880
 .
 .
 .
enableUserBuffer:       false
The messages for the handler are written to a common buffer.
You can set additional properties for the QuickTrace handler. For example, to enable user buffers for the users user1 and user2:
configureLogHandler(name="quicktrace-handler", addToLogger="oracle.adf.faces",
      propertyName="enableUserBuffer", propertyValue="true",
      propertyName="reserveBufferUserID", propertyValue="user1, user2")
...
Handler Name: quicktrace-handler
type:   oracle.core.ojdl.logging.QuickTraceHandlerFactory
useLoggingContext:      false
bufferSize:     5242880
 .
 .
 .
reserveBufferUserID:    user1, user2
enableUserBuffer:       true
Messages for user1 and user2 are written to separate buffers. In addition, messages related to other users are written to the common buffer.
To confirm the settings for the handler, use the listLogHandlers command, as described in "listLogHandlers" in the Oracle Fusion Middleware WebLogic Scripting Tool Command Reference.
Set the level of the logger, using the setLogLevel command:
setLogLevel(logger='oracle.adf', level='TRACE:1')
To confirm the settings for the logger, use the listLoggers command, as described in "listLoggers" in the Oracle Fusion Middleware WebLogic Scripting Tool Command Reference.
Many loggers are associated with other handlers. For example, the oracle.adf logger is associated with the handlers odl-handler, wls-domain, and console-handler. When you set the level of the logger, these handlers will use the same level (TRACE:1) for the logger oracle.adf. As a result, much information will be written to the log files, consuming resources. To avoid consuming resources, set the level of the handlers to a lower level, such as WARNING or INFORMATION.
For this example, set the level of the three handlers to WARNING:1:
configureLogHandler(name="odl-handler", level="WARNING:1")
configureLogHandler(name="wls-domain", level="WARNING:1")
configureLogHandler(name="console-handler", level="WARNING:1")
Note that you should keep the level of the QuickTrace handler at ALL, which is the default.
See Also:
The command "configureLogHandler" in the Oracle Fusion Middleware WebLogic Scripting Tool Command Reference
To confirm the level for the handler, use the getLogLevel command, as described in Section 12.4.3.2.
You can save the messages to a file by using the executeDump command.
For example:
executeDump(name="odl.quicktrace", outputFile="/scratch/oracle1/qt1.dmp")
The command writes the dump to the specified file.
For more information about the executeDump command, see Section 13.4.4.3.
In addition, if an incident is created (automatically or manually), the QuickTrace messages are written to dump files in the incident directory. If you enabled user buffers, each user will have one file and the common buffer will have one file.
The file names have the following format:
odl_quicktraceN_iincident_number.username.dmp
For example:
odl_quicktrace6_i1.weblogic.dmp
See Section 13.4.6.1 for information about creating an incident.
To disable QuickTrace, use the configureLogHandler command and specify that the level is OFF:
configureLogHandler(name="quicktrace-handler", level="OFF")

Handler Name: quicktrace-handler
type:   oracle.core.ojdl.logging.QuickraceHandlerFactory
 .
 .
 .
reserveBufferUserID:    user1, user2
enableUserBuffer:       true
To remove a specific logger from association with the QuickTrace handler, use the configureLogHandler command with the removeFromLogger parameter:
configureLogHandler(name="quicktrace-handler", removeFromLogger="oracle.adf.faces")

Handler Name: quicktrace-handler
type:   oracle.core.ojdl.logging.QuickraceHandlerFactory
reserveBufferUserID:    user1, user2
enableUserBuffer:       true
See Also:
The command "configureLogHandler" in the Oracle Fusion Middleware WebLogic Scripting Tool Command Reference
Selective tracing provides fine-grained logging for specified users or other attributes of a request.
For example, a user cannot perform some functions because of security permissions, but it is not clear what operations or lack of permission for those operations are posing a problem.
In this case, you can enable tracing across the entire system but this would generate a large volume of log messages for all users in the system, not only for the user having a problem. With selective tracing, you can enable tracing only for the user who is having a problem. Then, you can ask the user to retry the functions. Following that, you can look at the trace messages which apply to the specific request made by the user.
You can also specify the logger to narrow the scope of the messages being logged.
Before you use selective tracing:
Modify the following file:
(UNIX) DOMAIN_HOME/bin/setDomainEnv.sh
(Windows) DOMAIN_HOME\bin\setDomainEnv.cmd
Append the following lines to the file:
On UNIX:
JAVA_OPTIONS="-Djava.util.logging.manager=oracle.core.ojdl.logging.ODLLogManager ${JAVA_OPTIONS}"
export JAVA_OPTIONS
FMWCONFIG_CLASSPATH=${FMWCONFIG_CLASSPATH}${CLASSPATHSEP}${COMMON_COMPONENTS_HOME}/modules/oracle.odl_11.1.1/ojdl.jar
export FMWCONFIG_CLASSPATH
On Windows:
set JAVA_OPTIONS=-Djava.util.logging.manager=oracle.core.ojdl.logging.ODLLogManager %JAVA_OPTIONS%
set FMWCONFIG_CLASSPATH=%FMWCONFIG_CLASSPATH%;%COMMON_COMPONENTS_HOME%\modules\oracle.odl_11.1.1\ojdl.jar
Restart the Administration Server and Managed Servers, as described in Section 4.2.
If you upgraded a domain from a version previous to 11.1.1.5, you must take the following steps:
Back up the following file:
(Unix) DOMAIN_HOME/config/fmwconfig/mbeans/odl_mbeans.xml
(Windows) DOMAIN_HOME\config\fmwconfig\mbeans\odl_mbeans.xml
Back up the following file for all Managed Servers:
(Unix) DOMAIN_HOME/config/fmwconfig/servers/server_name/mbeans/odl_mbeans.xml

(Windows) ORACLE_COMMON_HOME\modules\oracle.odl_11.1.1\server_name]\mbeans\odl_mbeans.xml
Copy the following file:
(UNIX) ORACLE_COMMON_HOME/modules/oracle.odl_11.1.1/domain_config/mbeans/odl_mbeans.xml
(Windows) ORACLE_COMMON_HOME\modules\oracle.odl_11.1.1\domain_config\mbeans\odl_mbeans.xml
Copy it to the following location:
(UNIX) DOMAIN_HOME/config/fmwconfig/mbeans/odl_mbeans.xml
(Windows) DOMAIN_HOME\config\fmwconfig\mbeans\odl_mbeans.xml
Copy the following file:
(UNIX) ORACLE_COMMON_HOME/modules/oracle.odl_11.1.1/server_config/mbeans/odl_mbeans.xml
(Windows) ORACLE_COMMON_HOME\modules\oracle.odl_11.1.1\server_config\mbeans\odl_mbeans.xml
Copy it to the following location:
(UNIX)DOMAIN_HOME/config/fmwconfig/servers/server_name/mbeans/odl_mbeans.xml
(Windows) ORACLE_COMMON_HOME\modules\oracle.odl_11.1.1\server_name\mbeans\odl_mbeans.xml
Note that if you have multiple servers, you must copy the file to the location for each server.
You can use Selective Tracing using Fusion Middleware Control or WLST, as described in the following topics:
You can configure selective tracing, view traces, and disable selective tracing using Fusion Middleware Control, as described in the following topics:
To configure selective tracing using Fusion Middleware Control:
From the navigation pane, expand the farm, then WebLogic Domain. Right-click the domain name and choose Logs, then Selective Tracing.
The Selective Tracing page is displayed, as shown in the following figure:
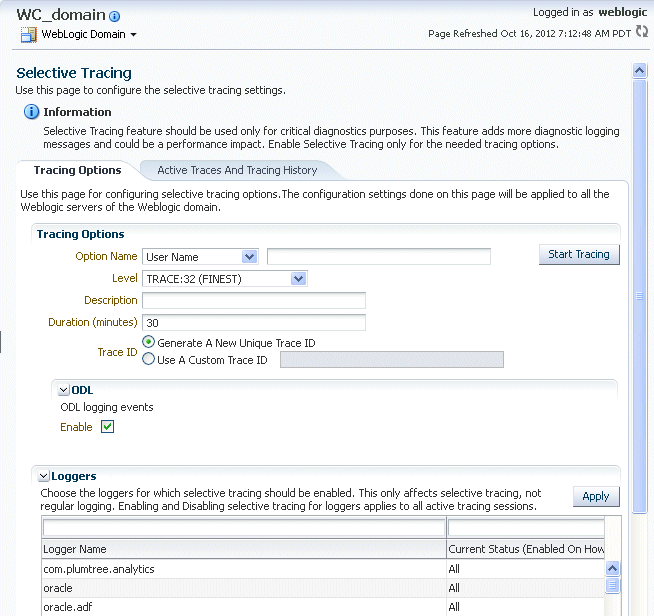
For Option Name, select an option, such as User Name, Application Name, or Client Host. Then, enter the name, for example, user1.
For Level, select a logging level. Table 12-3 describes the logging levels.
For Description, enter a description.
For Duration, enter the number of minutes that you want the selective trace to run.
The selective trace is disabled after the specified time.
For Trace ID, select either Generate a New Unique Trace ID or Use a Custom Trace ID. If you select Use a Custom Trace ID, enter an ID of your choosing, but make sure that it is unique. Note Fusion Middleware Control does not verify the uniqueness of the ID.
In the Loggers section, by default, all loggers are selected.
You can select specific loggers that you want to trace. To find particular loggers, you can enter a string in the field above the table and click the Return key. For example, to find all loggers that begin with oracle.security, enter oracle.security.
Then, in the table, select the loggers in the Enable on All Servers column.
Note when you select loggers, those loggers apply to all current and active traces. Also note that even if you disable the loggers, you may see messages because all loggers have a general logging level, such as Notification. Those messages would still be written.
Click Apply.
Click Start Tracing.
Now that you have started the trace, you can view active traces, as well as former traces, as described in Section 12.6.2.1.2.
You can view the selective traces that are currently active and the history of selective traces.
To view the selective traces:
From the Selective Tracing page, select the Active Traces and Tracing History tab.
The tab shows a table with the active traces and a table with the tracing history, as shown in the following figure:
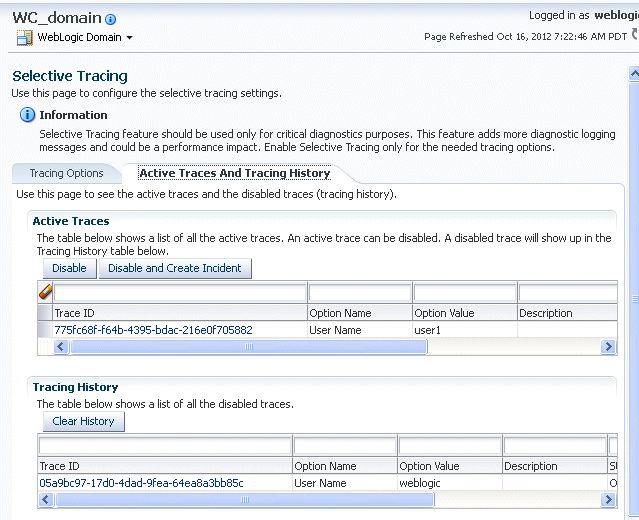
To view a trace, select it from the appropriate table.
The Log Messages page is displayed, with the messages that were captured by Selective Tracing. You can search the messages, as described in Section 12.3.2, and you can correlate the messages as described in Section 12.5.
In addition, you can download the messages to a file, as described in Section 12.3.3.1.
To disable selective tracing using Fusion Middleware Control:
From the navigation pane, expand the farm, then WebLogic Domain. Right-click the domain name and choose Logs, then Selective Tracing.
Select the Active Traces and Tracing History tab.
In the Active Traces table, select the trace and click Disable.
You can configure selective tracing, view traces, and disable selective tracing using WLST, as described in the following topics:
You can configure loggers for selective tracing and start tracing using the WLST configureTracingLoggers and startTracing commands.
For the simplest case, you can configure and start a trace using the startTracing command. When you do so, the selective tracing includes all loggers enabled for selective tracing.
For example, user1 receives errors when attempting to perform certain operations. To start a trace of messages related to user1 and to set the logging level to FINE, use the following command:
startTracing(user="user1",level="FINE")
Started tracing with ID: 885649f7-8efd-4a7a-9898-accbfc0bbba3
The startTracing command does not provide options to include or exclude particular loggers. In this case, you can use the configureTracingLoggers command. This command allows you to configure selective tracing to include only particular loggers and particular Oracle WebLogic Server instances. Note that the options you specify apply to all current and active traces.
For example, to configure selective tracing to include only security-related loggers:
Specify that all loggers be disabled for tracing, as shown in the following example:
configureTracingLoggers(action="disable")
Configured 1244 loggers
Enable the security-related loggers, by specifying the pattern option with a regular expression:
configureTracingLoggers(pattern='oracle.security.*', action="enable")
Configured 62 loggers
To see a list of the loggers that support selective tracing, use the WLST listTracingLoggers command, as shown in the following example:
listTracingLoggers(pattern="oracle.security.*")
------------------------------------------------------------------+--------
Logger                                                            | Status
------------------------------------------------------------------+--------
oracle.security                                                   | enabled
oracle.security.audit.logger                                      | enabled
oracle.security.jps.az.common.util.JpsLock                        | enabled
 .
 .
 .
Use the startTracing command, specifying the users and the level. For example:
startTracing(user="user1",level="FINE")
Started tracing with ID: a9580e65-13c4-420b-977e-5ba7dd88ca7f
See Also:
The following commands in the Oracle Fusion Middleware WebLogic Scripting Tool Command Reference for complete syntax:
After you have begun a trace, you can see the active traces by using the listActiveTraces command, as shown in the following example:
listActiveTraces()
-------------------------------------+----------+-----------+------+-----------+-----------
Trace ID                             |Attr. Name|Attr. Value| Level| Exp. Time |Description
-------------------------------------+----------+-----------+------+-----------+-----------
a9580e65-13c4-420b-977e-5ba7dd88ca7f |USER_ID   |user1      | FINE |           |
a04b47f7-2830-4d80-92ee-ba160cdacf6b |USER_ID   |user2      | FINE |           |
You can view the contents of the trace using the displayLogs command and passing it the trace ID. You can also view traces that have stopped. For example:
displayLogs("a9580e65-13c4-420b-977e-5ba7dd88ca7f")
See Also:
The listActiveTraces command in the Oracle Fusion Middleware WebLogic Scripting Tool Command Reference for complete syntax
To avoid excessive logging in the system, you can disable a selective trace when you have obtained the information that you need. To disable a selective trace, you use the WLST stopTracing command, passing it the trace ID or user. For example:
stopTracing(traceId="885649f7-8efd-4a7a-9898-accbfc0bbba3")
Stopped 1 traces
You can also disable all traces by using the stopAll option. For example:
stopTracing(stopAll=1)
See Also:
The stopTracing command in the Oracle Fusion Middleware WebLogic Scripting Tool Command Reference for complete syntax