The Pivot Table component allows users to perform comparisons and identify trends across several cross sections of data.
The values in the header rows and columns represent every possible grouping of the selected data fields.
Each body cell contains a metric value that corresponds to the intersection of the values in the heading rows and columns. In the following example, the first (top left) summary cell contains the average score for Best Buy red wines in 1992.
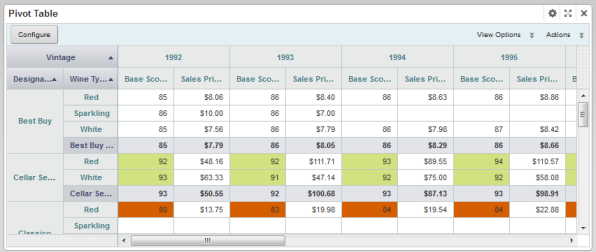
Cells may also be highlighted based on the displayed value. In the example, values are highlighted in red if they are below a certain number, and in green if they are above a certain number.
