Configuring the chart legend

The chart legend identifies by color each displayed data series. Each pie wedge, bar section, line, or shaded area is represented by an item on the legend.

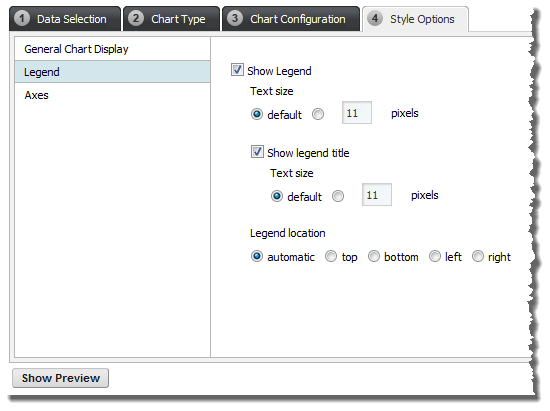
On the Style Options tab, to configure the legend for the chart:

  1. Click the Legend section heading.
    Legend section of the Style Options tab on the chart edit view
  2. To display the legend on the chart, check the Show Legend checkbox.

    If the box is unchecked, then there is no legend on the chart.

  3. If the legend is displayed, then:
    1. Under Text size, indicate how to determine the size of the legend text.

      To use the default text size for the legend, click the default radio button. This is the default setting.

      To specify a text size, click the other radio button, then in the field, type the size in pixels.

    2. To display a title for the legend, click the Show legend title checkbox.
    3. If the title is displayed, then under Text size, indicate how to determine the size of the legend title.
    4. Under Legend location, click the appropriate radio button to indicate where on the chart to display the legend.

      To have the location set automatically based on the size and configuration of the chart, click the automatic radio button. This is the default setting.

      You also can display the legend above the chart (top), below the chart (bottom), to the left of the chart (left), or to the right of the chart (right).

      If the legend is at the left or right, then it becomes scrollable if there are too many items to display at once. Legends above or below the chart do not scroll.