Configuring the display of the chart title

At the bottom of the Chart Configuration tab are fields for configuring the display of the chart title. The title can include variables to display the names of the current metrics and dimensions.

The chart title, if displayed, is above the chart.

To configure the chart title:

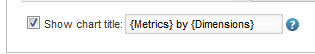
  1. To display a title for the chart, check the Show chart title checkbox.
    Excerpt from the Configuration tab of the chart edit view showing the chart title checkbox and field
  2. In the text field, enter the title to display.
    In the title text, you can use the following dynamic values:
    • {Metrics}, to show all of the current metrics
    • {Dimensions}, to show all of the current dimensions. This includes both group and series dimensions.
    • {Group}, to show the current group dimension
    • {Series}, to show the current series dimension. Remember that end users can choose to remove the series dimension, in which case this value will be empty.
    • {X-Metric}, to show the current X-axis metric. This can only be used for Scatter/Bubble charts.
    • {Y-Metric}, to show the current Y-axis metric. This can only be used for Scatter/Bubble charts.

    For example, {Metrics} for each {Group} and {Series} might display as "Sales (sum) for each Region and Product Line".

    The default is {Metrics} by {Dimensions}, which might display as "Sales (sum) by Region, Product Line".