For each available dimension, you can configure whether to allow refinement by the dimension values, and whether to allow cascading of the dimension.
If a dimension is hierarchical, then when the dimension value is used for refinement, the Chart component is displayed using the values from the next level in the hierarchy. For example, for the Wine Type dimension, if a user clicks the Red dimension value on the chart, the next level of values under Red - Bordeaux, Merlot, Pinot Noir, etc. - are displayed.
If the dimension allows cascading, then when the data is refined so that only one dimension value is displayed, the chart can be updated to use a different dimension.
When there are no more dimensions to cascade to, the chart remains on the last dimension in the cascade.
- When users refine the data to only show records for the United States, the chart displays sales totals grouped by state (within the United States).
- If users then refine the data to only show records for California, the chart displays sales totals grouped by supplier (within California).
- If users then refine the data by a specific supplier, the chart displays a single value for the selected supplier, and the cascade stops.
- As a general rule, if the dimension is not available in the Guided Navigation component, then in the Chart component, the dimension cannot be used for hierarchical refinement, and is skipped in a cascade.
- For multi-or or multi-and dimensions, where users can refine by more than one value, then if the data is refined by any one of the dimension values, then the cascade continues to the next dimension, even if there are still available values to refine by.
- For dimensions based on managed attributes, whether the dimension can be used in a cascade is based on precedence rules and other settings in the Oracle Endeca Server. See the Oracle Endeca Server Developer's Guide for more information. These rules may cause a managed attribute in a cascade to be skipped unexpectedly, even if it is at the top of the cascade.
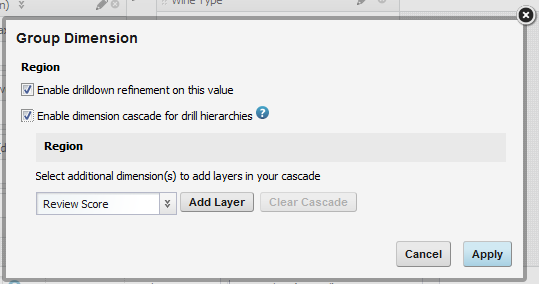
To configure a dimension:
-
To allow the dimension to cascade, check the
Enable dimension cascade for drill hierarchies
checkbox.
The cascade configuration is displayed. The dimension is automatically at the top of the cascade. A drop-down list is displayed for you to select the next dimension in the cascade.
-
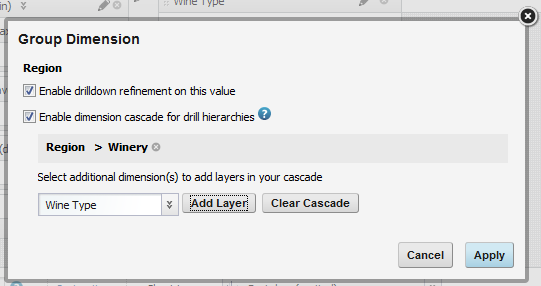
If you are allowing the dimension to cascade:
-
To add a new layer to the cascade, select the dimension for
that layer from the drop-down list, then click
Add Layer.
The new layer is added to the end of the cascade.
-
To add a new layer to the cascade, select the dimension for
that layer from the drop-down list, then click
Add Layer.
