Each chart may be configured with multiple options for the specific metrics and dimensions to display on the chart. The chart may also allow you to change the chart sort order, and to page through the chart data.
To select the data to display on the current view:
-
To change the dimensions and metrics displayed on the chart, from
the drop-down lists at the bottom of the chart, select the specific items to
display.
The number of drop-down lists varies based on the type of chart and whether an item has more than one option.
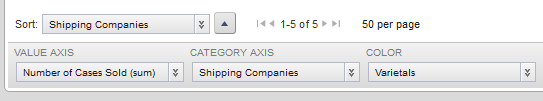
For example, for a Bar chart, you could see up to three drop-down lists:
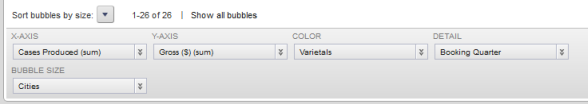
For a Bubble chart, you could see up to five drop-down lists:
-
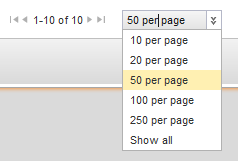
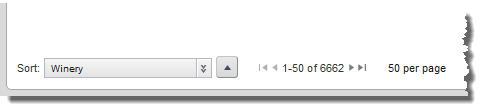
If the number of results is too large to display, then if the
chart supports pagination, you can page through the chart results.
You may also be able to select the number of results per page. If this option is available, then when you click the results per page, a drop-down list of available options is displayed.