You use the Chart Configuration tab to select the available metrics and dimensions to display on the chart.
The available options are based on the chart type:
| Chart Type | Available Options |
|---|---|
| Bar and Line/Area | Bar and Line/Area charts can display
multiple metrics at the same time.
Each option in the end user Metric drop-down list contains one or more metrics. Bar and Line/Area charts support both group and series dimensions. 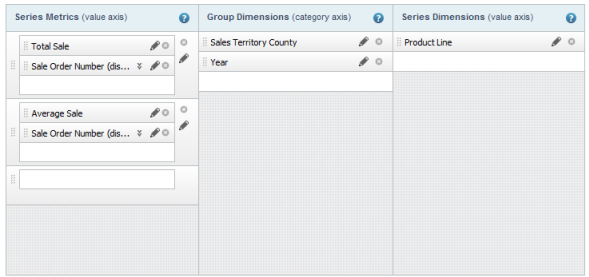 |
| Bar-Line | Bar-Line charts can display multiple bar
and line metrics at the same time.
Each option in the end user Metric drop-down list contains one or more bar metrics and one or more line metrics. Bar-Line charts do not support series dimensions. 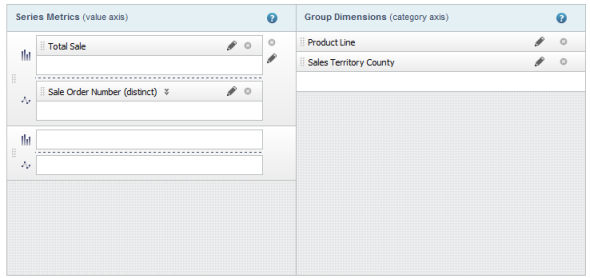 |
| Pie | Pie charts can display one metric at a
time.
Pie charts do not support series dimensions. 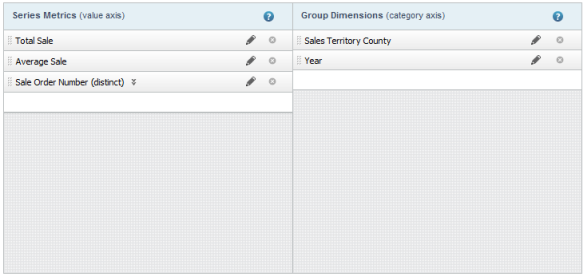 |
| Scatter/ Bubble | Scatter and bubble charts both support
X-axis and Y-axis metrics. Only one X-axis and Y-axis metric can be used at a
time.
Bubble and scatter charts support color and detail dimensions. 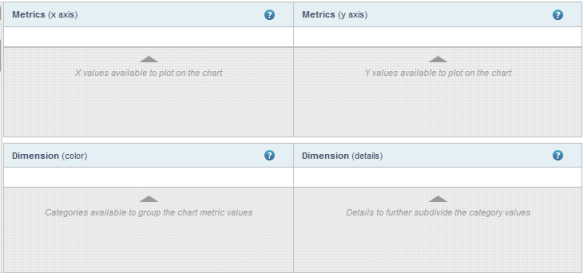 Bubble charts also support a third metric, the bubble size metric. Only one size metric can be used at a time. 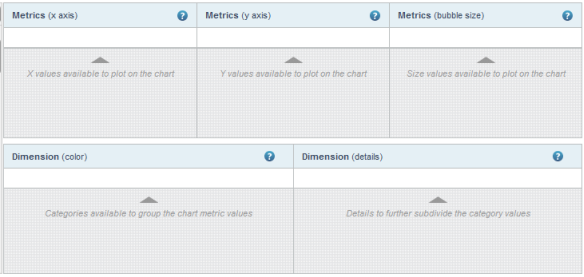 |
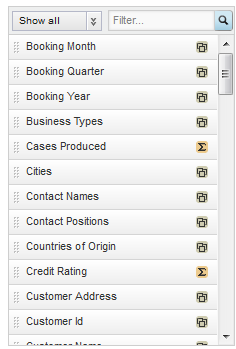
The available metrics and dimensions are displayed in the list at the left of the Chart Configuration tab. The items in the list are marked with an icon to indicate whether they are a metric or a dimension.
The list also contains system metrics for displaying counts of records or values.
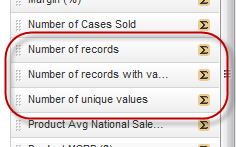
| Metric | Description |
|---|---|
| Number of records | The number of records in the underlying
data set that have the current dimension values.
For example, the Chart values are grouped by the Product Line dimension. A user adds a system metric to show the number of records for each dimension value. There are 15 records with Apparel as the product line. So for the Apparel Product line, the number of records is 15. |
| Number of records with values | The number of records that have a value
(other than NULL) for a selected attribute for the current dimension values.
When you select this option, you are prompted to select the attribute to use. For example, the Chart values are grouped by the Product Line dimension. A user adds a system metric show to the number of records with values for Color. Of the 15 records with Apparel as the product line, 4 records have Color set to Blue, 3 have Color set to Green, and 8 have no value for Color. So for the Apparel product line, the number of records with values for the Color attribute is 7. |
| Number of unique values | The number of unique values (other than
NULL) for a selected attribute for the current dimension values.
When you select this option, you are prompted to select the attribute to use. For example, the Chart values are grouped by the Product Line dimension. A user adds a system metric to show the number of unique values for Color for each dimension value. Of the 15 records with Apparel for the product line, 4 records have Color set to Blue, 3 have Color set to Green, and 8 have no value for Color. So for the Apparel product line, the number of unique values for Color is 2. |
Some metrics may be predefined, meaning that they have a built-in aggregation method that you cannot change.
If the metric is not predefined, then when you add it to the chart, a default aggregation method is assigned. The display name for the metric is the name of the attribute followed in parentheses by the aggregation method. For example, Sales (sum). You can then select a different aggregation method.
You can use the filter field or data type drop-down list to find a specific item.

To populate the available metrics and dimensions:
