Each Pivot Table consists of dimension rows and columns to determine the aggregation, and metrics to determine the displayed values.
The list at the left of the Table Layout tab of the Pivot Table edit view contains the available attributes from the selected view. The icons indicate whether an attribute is a dimension.
| Metric | Description |
|---|---|
| Number of records | Displays the number of records in the
underlying data set that have the current row and column dimension values.
For example, a Pivot Table is aggregated using Country and Product Line. In the current cell, the dimension values are United States for the country and Apparel for the product line. The number of records is the number of records that have the value United States for Country and Apparel for Product Line. |
| Number of records with values | Displays the number of records that have a
value (other than NULL) for a selected attribute for the combination of row and
column dimension values for the current cell.
When you select this option, you are prompted to select the attribute to use. For example, a Pivot Table is aggregated using Country and Product Line. Of the 15 records with United States as the Country and Apparel as the product line, 4 records have Color set to Blue, 3 have Color set to Green, and 8 have no value for Color. The number of records with values for the Color attribute is 7. |
| Number of unique values | Displays the number of unique values (other
than NULL) for a selected attribute for the combination of row and column
dimension values for the current cell.
When you select this option, you are prompted to select the attribute to use. For example, a Pivot Table is aggregated using Country and Product Line. Of the 15 records with United States as the Country and Apparel for the product line, 4 records have Color set to Blue, 3 have Color set to Green, and 8 have no value for Color. The number of unique values for Color is 2. |
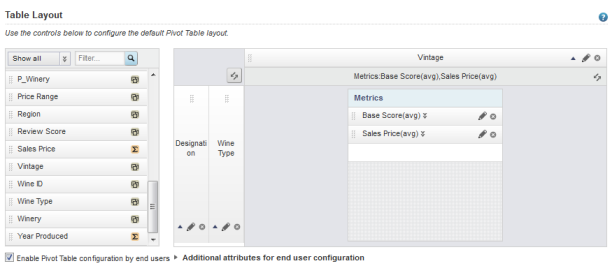
At the right of the Table Layout tab is a mockup of the Pivot Table format, with drop zones to add dimensions to the row and column groups, and to add metrics. A placeholder block indicates whether the metrics are displayed as columns or rows.
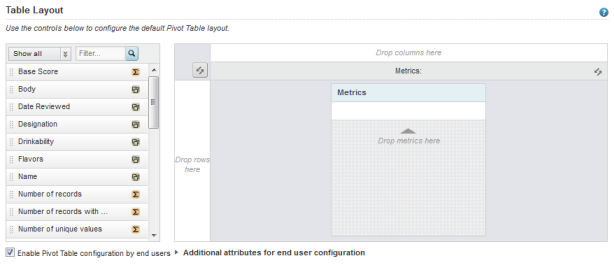
To populate the default view of the Pivot Table:
-
To add a metric to the
Pivot Table, drag the metric from the list to
the metric drop zone.
All metrics require an aggregation method (sum, avg, etc.) to determine how to calculate the metric value. If a metric is a predefined metric, then the aggregation method is built in and cannot be changed. Otherwise, when you add a metric, a default aggregation method is assigned. You can then change the method used.
For the Number of records with values and Number of unique values system metrics, when you add the metric to the Pivot Table, you are prompted to select the attribute to use for the count.
The order of the metrics in the list determines the order (from left to right for columns or top to bottom for rows) of the metrics in the Pivot Table. The placeholder also lists the selected metrics.