36 Testing and Debugging ADF Components
This chapter describes the tools for logging and testing an application that uses Oracle Application Development Framework (Oracle ADF). It contains debugging procedures for setting breakpoints using the ADF Declarative Debugger. Finally, it explains how to write and run regression tests for your ADF Business Components-based business services.
This chapter includes the following sections:
-
Section 36.2, "Correcting Simple Oracle ADF Compilation Errors"
-
Section 36.4, "Reloading Oracle ADF Metadata in Integrated WebLogic Server"
-
Section 36.7, "Using the Oracle ADF Model Tester for Testing and Debugging"
36.1 About ADF Debugging
Like any debugging task, debugging the web application's interaction with Oracle Application Development Framework (Oracle ADF) is a process of isolating specific contributing factors. However, in the case of web applications, generally this process does not involve compiling Java source code. Your web pages contain no Java source code, as such, to compile. In fact, you may not realize that a problem exists until you run and attempt to use the application. For example, these failures are only visible at runtime:
-
A page not found servlet error
-
The page is found, but the components display without data
-
The page fails to display data after executing a method call or built-in operation (like Next or Previous)
-
The page displays, but a method call or built-in operation fails to execute at all
-
The page displays, but unexpected validation errors occur
The failure to display data or to execute a method call arises from the interaction between the web page's components and the ADF Model layer. When a runtime failure is observed during ADF lifecycle processing, the sequence of preparing the model, updating the values, invoking the actions, and, finally, rendering the data failed to complete.
Fortunately, most failures in the web application's interaction with Oracle ADF result from simple and easy-to-fix errors in the declarative information that the application defines or in the EL expressions that access the runtime objects of the page's ADF binding container.
In your databound Fusion web application, you should examine the declarative information and EL expressions as likely contributing factors when runtime failures are observed. To understand editing the declarative files, see Section 36.2, "Correcting Simple Oracle ADF Compilation Errors," and Section 36.3, "Correcting Simple Oracle ADF Runtime Errors."
One of the most useful diagnostic tools is the ADF Logger. You use this logging mechanism in JDeveloper to capture runtime traces messages. With ADF logging enabled, JDeveloper displays the application trace in the Message Log window. The trace includes runtime messages that may help you to quickly identify the origin of an application error. Read Section 36.6, "Using the ADF Logger," to configure the ADF Logger to display detailed trace messages.
Supported Oracle ADF customers can request Oracle ADF source code from Oracle Worldwide Support. This can make debugging ADF Business Components framework code a lot easier. Read Section 36.8.1, "Using ADF Source Code with the Debugger," to understand how to configure JDeveloper to use the Oracle ADF source code.
If the error cannot be easily identified, you can utilize the ADF Declarative Debugger in JDeveloper to set breakpoints. When a breakpoint is reached, the execution of the application is paused and you can examine the data that the ADF binding container has to work with, and compare it to what you expect the data to be. Depending on the types of breakpoints, you may be able to use the step functions to move from one breakpoint to another. For more information about the debugger, read Section 36.8, "Using the ADF Declarative Debugger."
JDeveloper provides integration with JUnit for your Fusion web application through a wizard that generates regression test cases. Read Section 36.11, "Regression Testing with JUnit," to understand how to write test suites for your application.
36.2 Correcting Simple Oracle ADF Compilation Errors
When you create web pages and work with the ADF data controls to create the ADF binding definitions in JDeveloper, the Oracle ADF declarative files you edit must conform to the XML schema defined by Oracle ADF. When an XML syntax error occurs, the JDeveloper XML compiler immediately displays the error in the Structure window.
Although there is some syntax checking during design time, the JDeveloper compiler is currently limited by an inability to resolve EL expressions. EL expressions in your web pages interact directly with various runtime objects in the web environment, including the web page's ADF binding container. At present, errors in EL expressions can be observed only at runtime. Thus, the presence of a single typing error in an object-access expression will not be detected by the compiler, but will manifest at runtime as a failure to interact with the binding container and a failure to display data in the page. For information about debugging runtime errors, see Section 36.3, "Correcting Simple Oracle ADF Runtime Errors."
Tip:
The Expression Builder is a dialog that helps you build EL expressions by providing lists of objects, managed beans, and properties. It is particularly useful when creating or editing ADF databound EL expressions because it provides a hierarchical list of ADF binding objects and their valid properties from which you can select. You should use the Expression Builder to avoid introducing typing errors. For details, see Section 13.8, "Creating ADF Data Binding EL Expressions."
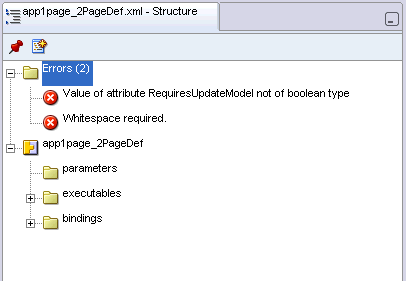
Example 36-1 illustrates two simple compilation errors contained in a page definition file: tru instead of true and id="CountryCodesView1Iterator"/ instead of id="CountryCodesView1Iterator"/> (that is, the ID is missing a closing angle bracket).
Example 36-1 Sample Page Definition File with Two Errors
<?xml version="1.0" encoding="UTF-8" ?>
<pageDefinition xmlns="http://xmlns.oracle.com/adfm/uimodel"
                version="11.1.1.42.54" id="app1page_2PageDef"
                Package="project1.pageDefs">
  <parameters/>
  <executables>
    <iterator Binds="CountryCodesView1" RangeSize="10"
              DataControl="AppModuleDataControl"
              id="CountryCodesView1Iterator"/
  </executables>
  <bindings>
    <action id="Find" RequiresUpdateModel="tru" Action="3"
             IterBinding="CountryCodesView1Iterator"/>
During compilation, the Structure window displays the XML errors in the page, as shown in Figure 36-1.
The Compiler-Log window also displays the compilation errors in the page, as shown in Figure 36-2.
To view and correct schema validation errors:
-
From the main menu, choose View > Structure to open the Structure window or View > Log to open the Log Window.
-
In either window, double-click the error message to open the file in the XML editor.
-
In the XML editor, locate the highlighted lines.
The highlighted lines will be lines with errors.
-
Correct any errors.
After an error has been corrected, the corresponding error message will be automatically removed from the Structure window.
-
Optionally, you can recompile the project by choosing Run > Make and checking to see whether the compiler still produces the error message.
36.3 Correcting Simple Oracle ADF Runtime Errors
Failures of the ADF Model layer cannot be detected by the JDeveloper compiler, in part because the page's data-display and method-execution behavior relies on the declarative ADF page definition files. The ADF Model layer utilizes those declarative files at runtime to create the objects of the ADF binding container.
To go beyond simple schema validation, you will want to routinely run and test your web pages to ensure that none of the following conditions exists:
-
The project dependency between the data model project and the user interface project is disabled.
By default, the dependency between projects is enabled whenever you create a web page that accesses a data control in the data model project. However, if the dependency is disabled and remains disabled when you attempt to run the application, an internal servlet error will be generated at runtime:
oracle.jbo.NoDefException: JBO-25002: Definition model.DataControls.dcx of type null not foundTo correct the error, double-click the user interface project, and select the Dependencies node in the dialog. Make sure that the ModelProjectName.jpr option appears selected in the panel.
-
Page definition files have been renamed, but the
DataBindings.cpxfile still references the original page definition file names.While JDeveloper does not permit these files to be renamed within the IDE, if a page definition file is renamed outside of JDeveloper and the references in the
DataBindings.cpxfile are not also updated, an internal servlet error will be generated at runtime:oracle.jbo.NoDefException: JBO-25002: Definition oracle.<path>.pageDefs.<pagedefinitionName> of type Form Binding Definition not foundTo correct the error, open the
DataBindings.cpxfile and use the source editor to edit the page definition file names that appear in the<pageMap>and<pageDefinitionUsages>elements. -
The web page file (
.jspor.jspx) has been renamed, but theDataBindings.cpxfile still references the original file name of the same web page.The page controller uses the page's URL to determine the correct page definition to use to create the ADF binding container for the web page. If the page's name from the URL does not match the
<pageMap>element of theDataBindings.cpxfile, an internal servlet error will be generated at runtime:javax.faces.el.PropertyNotFoundException: Error testing property <propertyname>To correct the error, open the
DataBindings.cpxfile and use the source editor to edit the web page file names that appear in the<pageMap>element. -
Bindings have been renamed in the web page EL expressions, but the page definition file still references the original binding object names.
The web page may fail to display information that you expect to see. To correct the error, compare the binding names in the page definition file and the EL expression responsible for displaying the missing part of the page. Most likely the mismatch will occur on a value binding, with the consequence that the component will appear but without data. Should the mismatch occur on an iterator binding name, the error may be more subtle and may require deep debugging to isolate the source of the mismatch.
-
Bindings in the page definition file have been renamed or deleted, and the EL expressions still reference the original binding object names.
Because the default error-handling mechanism will catch some runtime errors from the ADF binding container, this type of error can be very easy to find. For example, if an iterator binding named
findUsersByNameIterwas renamed in the page definition file, yet the page still refers to the original name, this error will display in the web page:JBO-25005: Object name <iterator> for type Iterator Binding Definition is invalidTo correct the error, right-click the name in the web page and choose Go to Page Definition to locate the correct binding name to use in the EL expression.
-
EL expressions were written manually instead of using the expression picker dialog and invalid object names or property names were introduced.
This error may not be easy to find. Depending on which EL expression contains the error, you may or may not see a servlet error message. For example, if the error occurs in a binding property with no runtime consequence, such as displaying a label name, the page will function normally but the label will not be displayed. However, if the error occurs in a binding that executes a method, an internal servlet error
javax.faces.el.MethodNotFoundException:methodnamewill display. Or, in the case of an incorrectly typed property name on the method expression, the servlet errorjavax.faces.el.PropertyNotFoundException:propertynamewill display.
If this list of typical errors does not help you to find and fix a runtime error, you can initiate debugging within JDeveloper to find the contributing factor. For an ADF application, start setting ADF declarative breakpoints to find the problem. Using the ADF Declarative Debugger to set ADF declarative breakpoints is described in Section 36.8, "Using the ADF Declarative Debugger," and Section 36.9, "Setting ADF Declarative Breakpoints." This process involves pausing the execution of the application as it proceeds through the application and examining data. You can also use the ADF Declarative Debugger to set Java code breakpoints, as described in Section 36.10, "Setting Java Code Breakpoints."
36.4 Reloading Oracle ADF Metadata in Integrated WebLogic Server
JDeveloper support for hot reloading of Oracle ADF metadata is an alternative to quitting the running application, editing your project's XML definition files, redeploying, and rerunning the application in Integrated WebLogic Server to view the latest changes.
Changes that you make to the Fusion web application projects will not be picked up automatically by an application that you have deployed to Integrated WebLogic Server. You can, however, reload metadata from the data model project and user interface project any time you want to synchronize the running application with changes you have made to your application's XML definition files.
To reload metadata so your changes are reflected in the deployed Fusion web application, you must recompile the project and refresh the web browser.
Metadata that JDeveloper will hot reload in Integrated WebLogic Server, include:
-
In the data model project, changes to the definition files of business components.
-
In the user interface project, changes to the binding definitions in the page definition files and changes to task flows in the task flow definition files.
This support makes it possible to make incremental changes and test them.
36.5 Validating ADF Controller Metadata
Basic validation is performed when ADF Controller retrieves metadata. The most serious errors, for example, a task flow that is missing a default activity, result in parsing exceptions.
The enable-grammar-validation setting in adf-config.xml allows you to validate the grammar in ADF Controller metadata before deploying an application. When enable-grammar-validation is set to true, ADF Controller metadata is validated against ADF Controller XSDs. For example, invalid characters in ADF Controller metadata, such as a slash (/) in a view activity ID, are flagged as exceptions.
By default, enable-grammar-validation is set to false. For performance reasons, it should be set to true only during application development or when troubleshooting an application.
36.6 Using the ADF Logger
If you are not able to easily find the error in either your web page or its corresponding page definition file, you can use the JDeveloper debugging tools to investigate where your application failure occurs.
You configure the logging session by editing the logging.xml configuration file using the editor for Oracle Diagnostic Logging Configuration. Logging configuration can be set at any time, even while the application is running in JDeveloper.
Unlike many files in JDeveloper, you cannot directly open the logging.xml file. Instead you use menu commands at these locations to open the Oracle Diagnostic Logging Configuration editor:
-
Right-click an active server instance in the Application Server Navigator window.
-
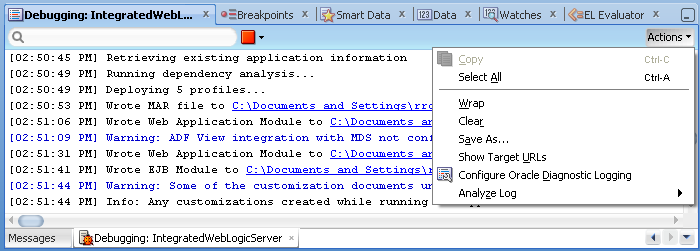
Click the Actions dropdown menu displayed in the Log window's debugger process panel, after you have started the application in debug mode.
You use the Oracle Diagnostic Logging Configuration editor to set the desired logging level to control the level and number of messages that are displayed. You can set the logging level for both persistent and transient loggers and declare handlers for each logger.
JDeveloper creates diagnostic log files in the Oracle Diagnostic Logging (ODL) format, used by Oracle Fusion Middleware components. Log file naming and the format of the contents of log files conform to an Oracle standard. By default, the diagnostic messages are in text format. For more information about the ODL format, see the Oracle Fusion Middleware Administrator's Guide.
In the editor, as an alternative to the default ODL format, you can configure the Java Logger to display Java diagnostic messages.
After you have created a log, you can view and filter the log messages with Oracle Diagnostic Log Analyzer. This tool allows you to set filters for different log levels, define message time frames, and search on message text.
You can then use the ADF Declarative Debugger to set breakpoints and examine the the application. For more information, see Section 36.9, "Setting ADF Declarative Breakpoints," and Section 36.10, "Setting Java Code Breakpoints."
36.6.1 How to Set ADF Logging Levels
You can use the Oracle Diagnostic Logging Configuration editor to configure the logging levels specified in the logging.xml configuration file. The file can be configured before and while the application is running in Integrated WebLogic Server. The changes will apply without the need to restart the server.
When Integrated WebLogic Server is running, you can define both persistent and transient loggers. When Integrated WebLogic Server is not running, you can only define persistent loggers. The transient loggers will last only for the session and will not be entered in the logging.xml configuration file. If the server is not running, you must explicitly save the configuration changes to the logging.xml file for the updates to take effect in the next server run.
You can access the Oracle Diagnostic Logging Configuration editor from the Application Server Navigator or from the Log window, which is shown in Figure 36-3.
However, while the server is running, when you access the editor via the Log window menu, then the editor has the ability to add transient loggers.
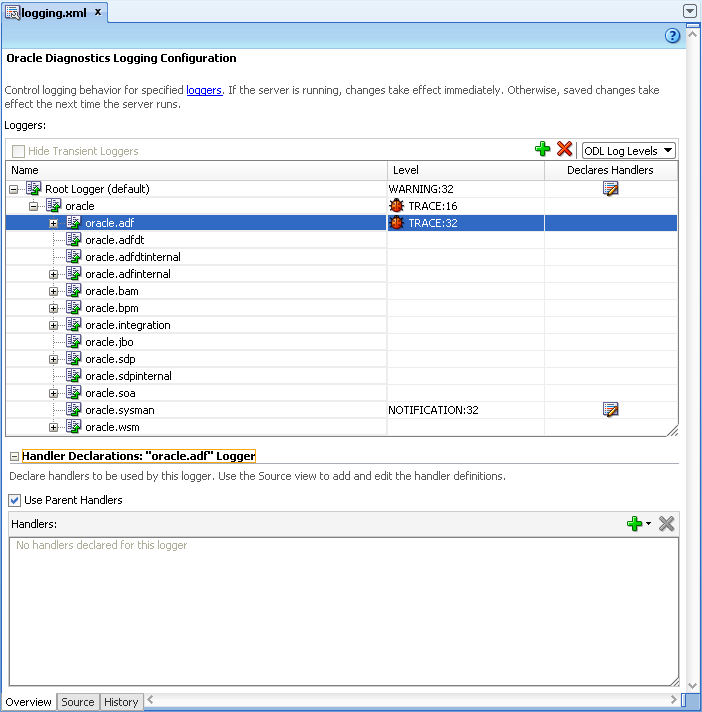
Figure 36-4 shows the Oracle Diagnostic Logging Configuration while the server is running.
You can only use JDeveloper menu commands to open the logging.xml configuration file and launch the editor for Oracle Diagnostic Logging Configuration. However, you may find the following information about the location of the configuration file useful.
Note:
You can declare and add log handler definitions by clicking the Source tab and entering them in the XML editor.
If you are using Integrated WebLogic Server in JDeveloper on the Windows platform, you can find the logging.xml configuration file in a location similar to:
C:\Documents and Settings\username\ApplicationData\JDeveloper\latest_system_ folder\DefaultDomain\config\fmwconfig\servers\DefaultServer
The log files for Integrated WebLogic Server are in a location similar to:
C:\Documents and Settings\username\ApplicationData\JDeveloper\latest_system_ folder\DefaultDomain\servers\DefaultServer\logs
The log files for a standalone WebLogic Server instance are in a location similar to:
$domain_home/servers/your_servername/logs
You can configure logging levels before a test run from the Application Server Navigator or during a debug session from the Log window toolbar.
-
In the Application Server Navigator, right-click IntegratedWebLogicServer and choose Configure Oracle Diagnostic Logging for server name.
Or, from the Log window's debug process panel, choose Actions - Configure Oracle Diagnostic Logging. The debug process panel is only visible in the Log window after you have started the application in debug mode.
-
In the editor for Oracle Diagnostics Logging Configuration, select ODL Log Levels or Java Log Levels for the logger type you want to view.
-
If you want to see persistent loggers only, select Hide Transient Loggers.
-
To add a logger:
-
If the server is running, click the Add icon dropdown menu and choose Add Persistent Logger or Add Transient Logger. If the server is not running, click Add to add a persistent logger. You cannot add a transient logger.
-
In the Add Logger dialog, enter a logger name.
-
Select the logging level.
-
Click OK.
-
-
For any logger, including a newly created logger, you can specify its handlers by selecting from a list of available handlers by clicking the Add icon in the Handler Declarations section.
Or, you can select Use Parent Handlers to assign its parent's handler to the logger. By default, a logger uses its parent's handler.
Note:
You can declare and add log handler definitions by clicking the Source tab and entering them in the XML editor.
36.6.2 How to Turn On Diagnostic Logging
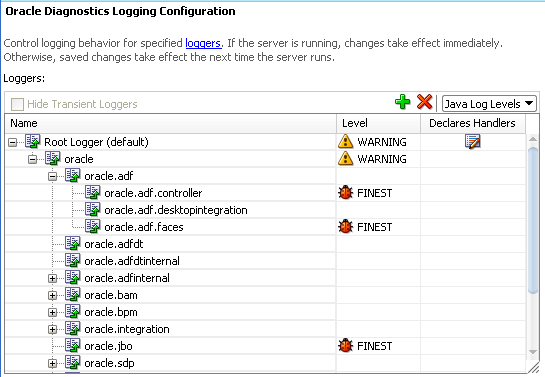
Even before you use the actual debugger, running the application with loggers set to Java log level FINE, FINER, or FINEST will enable framework diagnostics logging. The debug diagnostic messages can be helpful to see what happens when the problem occurs. To enable debug diagnostic messages, use the Oracle Diagnostics Logging Configuration Editor to configure the desired loggers with a Java log level set to FINEST.
If you have configured diagnostic logging for the supported loggers, JDeveloper will direct debug diagnostics messages to the JDeveloper Log window. Figure 36-5 shows specific loggers configured to enable the most detailed Oracle ADF debug diagnostics.
For backward compatibility, the Java system property jbo.debugoutput set to the value console or ADFLogger (to route diagnostics through the standard Logger implementation, which can be controlled in a standard way through the logging.xml file) is supported. The easiest way to set this system property while running your application inside JDeveloper is to edit your project properties and in the Run/Debug page, select a run configuration and click Edit. Then add the string -Djbo.debugoutput=console to the Java Options field.
36.6.3 How to Create an Oracle ADF Debugging Configuration
Oracle ADF leverages the Java Logging API (java.util.logging.Logger) to provide logging functionality when you run a debugging session. Java Logging is a standard API that is available in the Java platform at http://download.oracle.com/javase/1.4.2/docs/guide/util/logging/overview.html.
To create an ADF Model debugging configuration:
-
In the editor for Oracle Diagnostics Logging Configuration, select ODL Log Levels or Java Log Levels for the logger type you want to view.
-
Expand the oracle.adf logger node and select the Java log level FINEST for the desired Oracle ADF loggers.
-
Optionally, to enable ADF Business Components diagnostics, for the oracle.jbo logger, select the Java log level FINEST.
To create an ADF view Javascript logging configuration:
-
In the Application Navigator, double-click the application or project web.xml file.
-
In the source editor, add the following elements to the file:
<context-param>
  <param-name>
     oracle.adf.view.rich.LOGGER_LEVEL
  </param-name>
  <param-value>
      FINE
  </param-value>
</context-param>
36.6.4 How to Use the Log Analyzer to View Log Messages
You can use Oracle Diagnostic Log Analyzer to view the log entries of a log file. The log analyzer allows you to filter the entries by log level, entry type, log time, and entry content (using a query panel). You can also order the messages and show and hide columns for better viewing.
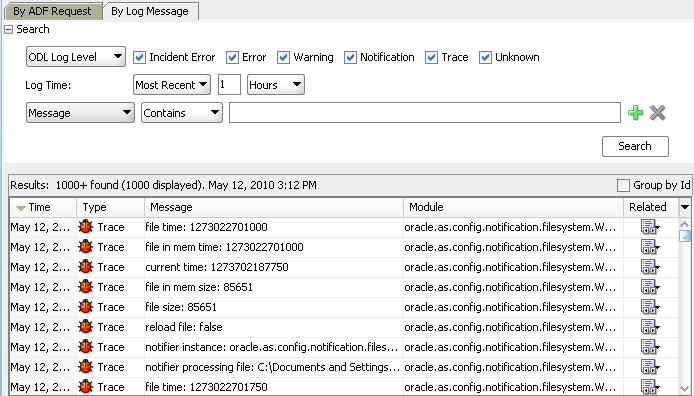
Figure 36-6 shows Oracle Diagnostic Log Analyzer set to view ODL Log levels.
You can also use the log analyzer on log files created in other test runs. For instance, you can analyze the log sent to you by another developer for another application.
36.6.4.1 Viewing Diagnostic Messages in the Log Analyzer
You can configure logging levels before a test run from the Application Server Navigator or during a debug session from the Log window toolbar. The level you specify will determine the type and quantity of log messages.
In the case of ADF events, all messages are generated for the ODL log at the level Notification or for the Java log at the level Info. Fewer ADF messages will be generated at the Incident Error/Severe and Error/Warning levels.
After you select the log level for the messages you wish to view, you can use the Search panel of the By Log Message page to filter the messages to display from the log file.
Note:
For further details about search criteria that you can specify to search on ADF-specific messages, see Section 36.6.4.3, "Sorting Diagnostic Messages By ADF Events."
You can start the log analyzer before a test run from the Tools menu or during a debug session from the log window toolbar.
It may be helpful to have an understanding of logging. For more information, see Section 36.6, "Using the ADF Logger."
You will need to complete these tasks:
-
Enable logging, as described in Section 36.6.2, "How to Turn On Diagnostic Logging."
-
Set logging levels, as described in Section 36.6.1, "How to Set ADF Logging Levels."
-
Create a log file, either from your test run or from another source.
-
From the main menu, choose Tools > Oracle Diagnostic Log Analyzer.
Or, from the Log window Action menu, choose Analyze Log and then either Current in Console or Open Selected (to browse log files in the server log directory).
-
In the editor for Oracle Diagnostic Log Analyzer, click the By Log Message tab.
-
In the By Log Message page, navigate to the log file or enter the path and name of the log file.
Tip:
The Choose Log File dialog helps you to navigate to the directory that contains the log files generated by JDeveloper. Click the Browse Log Files icon next to the Log text field, and then click the Server Logs icon from the scroll list. From the list of log files, you can select more than one log file to analyze at a time.
-
From the dropdown list, select either ODL Log Level or Java Log Level.
-
Select the corresponding checkbox for each type of log entry you want to view. You must select at least one type.
The available ODL log level types are:
-
Incident Error
-
Error
-
Warning
-
Notification - corresponds to ADF event messages
-
Trace
-
Unknown.
The available Java log level types are:
-
Severe
-
Warning
-
Info - corresponds to ADF event messages
-
Config
-
Fine
-
Finer
-
Finest
-
Unknown
-
-
Specify a time period for the entries you want to view. You can select the most recent period or a range.
-
To filter the results, use the Search panel to query the log for a text pattern. For additional Search panels, click Add. The supported search criteria include:
-
Detail: Filters text in statements from the stack where the method was invoked.
-
Message: Filters text in the logged messages.
-
ADF Context Data: Filters the log for data related to ADF lifecycle phase names, view object names, view object query statements, data control names, binding container names, and iterator binding names logged during the execution of ADF events.
-
Source Method: Filters the log by the method where the message is logged. For example, you can filter on the method
executeto view all messages logged for view object query execution or ADF lifecycle phase execution. -
Application: Filters the log by the application name where the message is logged. This is useful when the application is running in a composite application and you want to view messages for a specific application.
-
Source Class: Filters the log by the fully qualified class name of the method where the message is logged. To see more messages, enter a partial package name. For example, you can enter the partial package name
oracle.adfor the full package nameoracle.jboto filter for all classes related to Oracle ADF. -
Module: Filters the log by the fully qualified package name of the class where the message is logged. This is same package as the source class.
-
Message Id: Filters the log by the ID of the logged messages. Many messages share the same ID. For example, message ID
ADFC-52008might have fourINFOmessages and oneWarningmessage. You can select Group by Id in the log analyzer Results panel to group messages by their common ID.
-
-
To initiate the filters and display the log messages, click Search.
-
To order the results by the message ID, select the Group by Id checkbox.
-
To group the messages by time period or by request, in the Related column, select either Related by Time or Related by Request.
-
To show or hide columns in the Results section, click the dropdown list to the right of the column headers and select among the list of displayed columns to change the visibility of a column.
36.6.4.2 Using the Log Analyzer to Analyze the ADF Request
Because Oracle instrumented the Oracle ADF source code to generate log messages during the execution of the ADF lifecycle phases, you can use the log analyzer to investigate the details of the active (or previous) page request in your running application. Specifically, the By ADF Request page of the log analyzer lets you view ADF event messages in a hierarchical list, organized by the sequence of their execution. It also provides a graphical representation of the duration of each event. When you run your application and start the log analyzer with ADF logging configured, you can use this page to quickly identify whether a component of your application is contributing to a performance bottleneck due to unusually long execution times.
Note:
In contrast to the By Log Message page, the By ADF Request page of the log analyzer displays a hierarchical view of ADF event messages. The difference between these two pages is that the By ADF Request page focuses only on ADF page requests made when a page or region is submitted, and it provides the option to examine logged messages from multiple ADF requests. For details about the ADF page lifecycle, see Chapter 25, "Understanding the Fusion Page Lifecycle."
You can use the Search panel of the By ADF Request page to display one or more specific requests from the log file. The Search panel lets you combine any of the following search criteria:
-
The number of requests to display
-
The timestamp for the request recorded in the log
-
The logged-in user name, application name in a composite application, or page name as displayed in the request header
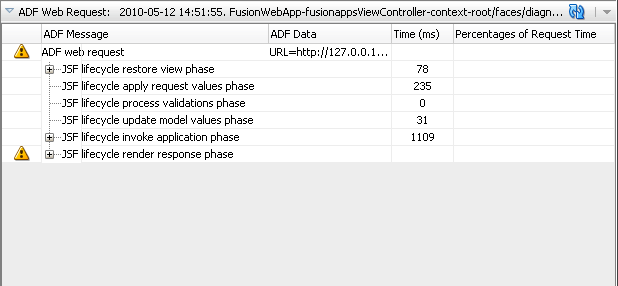
If you search on any of these criteria before the page request is complete, the ADF Web Request panel in the log analyzer displays a yellow triangle symbol to indicate that the phase has not yet completed. Figure 36-7 shows the icon for the JSF lifecycle Render Response phase and the root node for the overall request. To update the ADF Web Request panel with the latest information from the log, you can click on the refresh icon in the panel header.
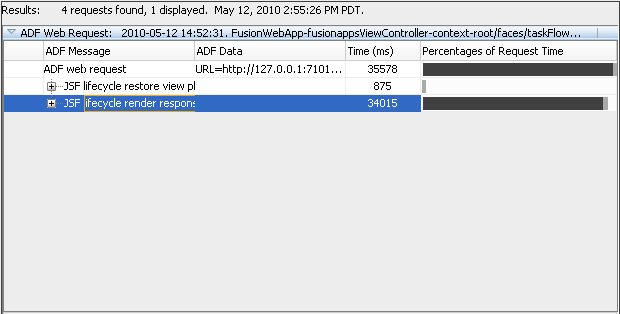
After the request is completed, the log analyzer displays duration bar graphs for each phase to show the percentages of request time that each event contributed to the overall page request. Figure 36-8 shows the ADF Web Request panel with the JSF lifecycle Render Response phase displaying 34015 milliseconds (34 seconds) for the duration of this portion of the overall page request. This example depicts an usually long duration for the render phase to illustrate how the bar graph can help you to identify a performance bottleneck that may occur during the execution of a page request. The bar graph for the root node of the request event hierarchy (ADF web request) displays the total execution time.
Note:
The Percentage Request Time bar graphs (black and gray) indicate which portion of the request's execution time resulted from ADF source code that was instrumented to generate ADF event messages (shown in black) and which portion resulted from ADF source code that is uninstrumented and therefore cannot generate ADF event messages (shown in gray). Additionally, note that the individual phases of the request do not sum to equal the total request time. This is due to the fact that only those phases of the lifecycle that are useful are represented in the log analyzer.
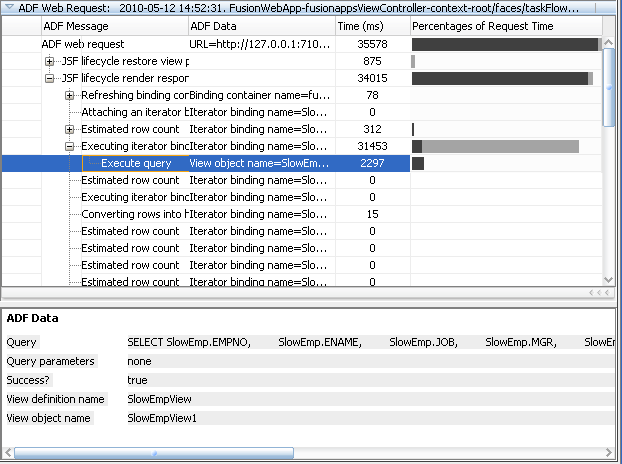
To examine the request in more detail, you can expand the tree for any ADF lifecycle node to further investigate where in the application the performance bottleneck occurred. Drilling down and then selecting the ADF event node in the ADF Web Request panel gives you details about the component associated with each ADF event. For instance, expanding the JSF lifecycle render response phase node displays all ADF events generated during that phase. Figure 36-9 shows the JSF lifecycle render response phase node expanded with a long request duration bar graph for the Execute iterator binding node and the Execute query node. The Execute query node has been selected to reveal detailed ADF data in the bottom portion of the panel, including the view object's name and query statement. By drilling down and selecting the ADF event with the long execution time as indicated by the bar graph, you can obtain, for example, the name of the view object in the data model project that should be tuned for improved performance.
It may be helpful to have an understanding of logging. For more information, see Section 36.6, "Using the ADF Logger."
You will need to complete these tasks:
-
Enable logging, as described in Section 36.6.2, "How to Turn On Diagnostic Logging."
-
Set logging levels, as described in Section 36.6.1, "How to Set ADF Logging Levels."
To log ADF event messages, do not configure an ODL log level that is more restrictive than
Notificationor a Java log level that is more restrictive thanInfofor the following packages:-
oracle.adfwill log events generated by source code for the ADF Model data binding layer and ADF Controller source code. -
oracle.jbowill log events generated by source code executed for ADF Business Components. -
oracle.adfinternalwill log events generated by source code executed from Oracle ADF internal classes.
Tip:
The default log level for the Root Logger displayed by the editor for Oracle Diagnostics Logging Configuration ensures that ADF event messages are logged.
-
-
Create a log file, either from your test run or from another source.
To display ADF request messages in the log analyzer:
-
From the main menu, choose Tools > Oracle Diagnostic Log Analyzer.
Or, from the Log window Action menu, choose Analyze Log and then either Current in Console or Open Selected (to browse log files in the server log directory).
-
In the editor for Oracle Diagnostic Log Analyzer, click the By ADF Request tab.
-
In the By ADF Request page, specify how many of the most recent request you want to display.
The default displays only the most recent request.
-
Specify a time period for the entries you want to view. You can select the most recent period or a range.
-
To filter the request to display, use the Search panel to query the log for a text pattern. For additional Search panels, click Add. The supported search criteria include:
-
The logged-in user name. This can be a specific user or
anonymousfor unauthenticated users. -
The application name. This is useful when the application is running in a composite application and you want to view messages for a specific application.
-
A JSF page name without the file name extension. The log records the page name in the request header. If the submitted page is
orderSummary.jspx, the logger recordsorderSummaryin the request header. The request header also appears in the collapsible ADF Web Request panel header of the By ADF Request page.
-
-
To initiate the filters and display the ADF event messages for the ADF request, click Search.
-
In the ADF Web Request panel, expand the completed ADF request and look for ADF events that display long execution times as indicated by the Request Time bar graphs.
If the page request has not completed, the yellow triangle symbols are displayed in the ADF Web Request panel. Wait a moment and then click the Refresh icon in the ADF Web Request panel.
-
Select the desired ADF event and examine the ADF Data panel for details about the ADF component associated with the ADF event.
-
Examine the component in your application and determine whether optimization is possible.
36.6.4.3 Sorting Diagnostic Messages By ADF Events
Oracle instrumented the Oracle ADF source code to generate log messages during the execution of the ADF lifecycle phases and during operations executed in the ADF Model data binding layer, ADF Controller source, and ADF Business Components source. Combined, the log analyzer refers to these messages as ADF events. You can use the log analyzer to investigate ADF events in your running application. The By Log Message page of the log analyzer lets you view ADF event messages in a flat list, organized by time of execution, with the option to switch to the By ADF Request page to view the ADF events in a hierarchical list, organized by the sequence of their execution.
ADF event messages contain useful information that helps you identify which ADF components in your application generated the event. For example, you can search the log for ADF event messages to identify the components related to displaying data in the page, executing queries, or initiating actions:
-
Executing iterator binding: Displays the names of the iterators executed to manage displaying data in the page. This can be useful for diagnosing slow query updates.
-
Execute query: Displays the name of the view object associated with the executed query. This can be useful when you want to view the query statement, bind parameters, and name of the view object.
-
Executing method binding: Displays the names of the Java methods executed on the bound data source. This can be useful for diagnosing slow method execution.
After you display an ADF event message in the log analyzer, you can organize the event in the context of other logged messages. You can select options from the Related column to display:
-
All messages leading up to the ADF event (related by time)
-
All messages in the same web request as the ADF event (related by request)
-
Only ADF event messages in the same web request (related by ADF request)
Tip:
The Related by ADF Request option displays detailed ADF data for the ADF event messages. This is the view to use, for example, when you want to display the query statement associated with the Execute query message.
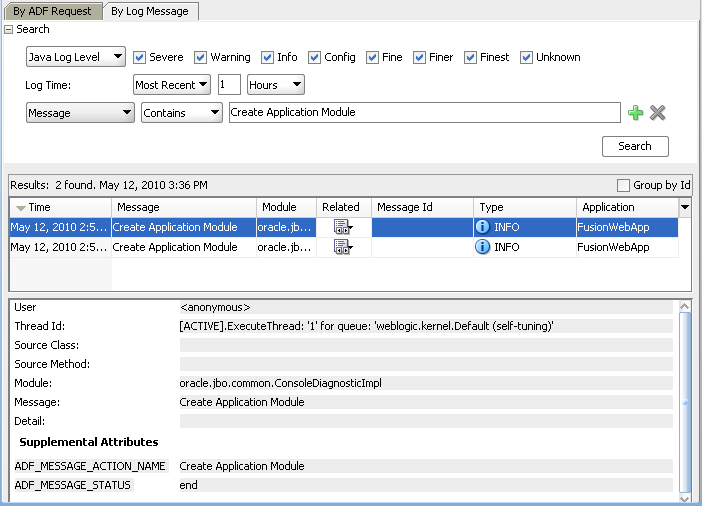
Figure 36-10 shows the log analyzer search result for the ADF event message Create Application Module. The Results panel displays all messages that match the search criteria and the bottom panel displays detailed information about the component.
When you select Related by ADF Request in the Related column of the Results panel, the log analyzer switches to display the By ADF Request page with the ADF event messages arranged hierarchically to show their execution dependencies. The By ADF Request page of the log analyzer is the preferred way to diagnose performance issues. For details about the By ADF Request page, see Section 36.6.4.2, "Using the Log Analyzer to Analyze the ADF Request." In the By Log Message page, the elapsed time is information that you can leave visible or hide from the Results panel.
It may be helpful to have an understanding of logging. For more information, see Section 36.6, "Using the ADF Logger."
You will need to complete these tasks:
-
Enable logging, as described in Section 36.6.2, "How to Turn On Diagnostic Logging."
-
Set logging levels, as described in Section 36.6.1, "How to Set ADF Logging Levels."
To log ADF event messages, do not configure an ODL log level that is more restrictive than
Notificationor a Java log level that is more restrictive thanInfofor the following packages:-
oracle.adfwill log events generated by source code for ADF Model data binding layer and ADF Controller source code. -
oracle.jbowill log events generated by source code executed for ADF Business Components. -
oracle.adfinternalwill log events generated by source code executed from Oracle ADF internal classes.
Tip:
The default log level for the Root Logger displayed by the editor for Oracle Diagnostics Logging Configuration ensures ADF event messages are logged.
-
-
Create a log file, either from your test run or from another source.
To display messages related by ADF events:
-
From the main menu, choose Tools > Oracle Diagnostic Log Analyzer.
Or, from the Log window Action menu, choose Analyze Log and then either Current in Console or Open Selected (to browse log files in the server log directory).
-
In the editor for Oracle Diagnostic Log Analyzer, click the By Log Message tab.
-
In the By Log Message page, select the desired logger type, log levels, and log time.
To search the log for ADF event messages, you must minimally select log level Notification (for ODL log level) or Info (for Java log level).
-
Choose the search criteria Message and Contains, and then enter any of the following ADF event messages and click Search.
You can also filter the log on these additional ADF event messages:
-
Executing iterator binding - this can be useful for diagnosing slow query updates.
-
Executing method binding - this can be useful for diagnosing slow method execution.
-
Execute query - this can be useful when you want to view the query statement, bind parameters, and name of the view object.
-
Refreshing binding container
-
Attaching an iterator binding to a datasource
-
Converting rows into hierarchical nodes
-
Estimated row count
-
Get LOV list
-
Filter LOV list
-
Validate Entity
-
Lock Entity's Parent
-
Lock Entity
-
Before posting the entity's changes
-
Posting the entity's changes
-
Posting in batches
-
Before committing the entity's changes
-
After committing the entity's changes
-
Before rolling back the entity's changes
-
After rolling back the entity's changes
-
Entity notifying an event
-
Entity notification name
-
Removing Entity
-
Updating audit columns
-
Applying Effective Date change
-
Entity DML
-
Entity read all attributes
-
Create Application Module
-
Create nested Application Module
-
Passivating Application Module
-
Activating Application Module
-
Establish database connection
-
Commit transaction
-
Rollback transaction
-
Validate transaction
-
Validate value
Examine the bottom portion of the Results panel for the ADF event information.
-
-
To view a hierarchical sequence of ADF events, with the desired ADF event message selected in the Results panel, choose Related - Related By ADF Request.
The editor for Oracle Diagnostic Log Analyzer displays the By ADF Request page for the selected ADF event. Examine the bottom portion of the Results panel for additional ADF data for the ADF event. For example, you can see the query statement associated with the
Execute querymessage in the ADF Data area of the Results panel.
36.6.5 What You May Need to Know About the Logging.xml File
By default, the level is set to INFO for all packages of Oracle ADF. Set level="FINE" for detailed logging diagnostics.
For the ADF view layer packages oracle.adf.view.faces and oracle.adfinternal.view.faces, edit these elements:
<logger name="oracle.adf" level="FINE"/>

<logger name="oracle.adfinternal" level="FINE"/>
For the ADF Model layer packages, edit these elements:
<logger name="oracle.adf" level="FINE"/>

<logger name="oracle.jbo" level="FINE"/>
For the ADF Controller layer packages, edit these elements:
<logger name="oracle.adf.controller" level="FINE"/>

<logger name="oracle.adfinternal.controller" level="FINE"/>
Alternatively, you can create a debug configuration in JDeveloper that you can choose when you start a debugging session.
Example 36-2 shows the portion of the logging.xml file where you can change the granularity of the log messages. Note in the example that the log for oracle.adf.faces has been changed to FINE to display more messages.
Example 36-2 Sample Section of the logging.xml Configuration File
</logging_configuration>
...
  <loggers>
      <logger name="oracle.adf" level="INFO"/>
      <logger name="oracle.adf.faces" level="FINE"/>
      <logger name="oracle.adf.controller" level="INFO"/>
      <logger name="oracle.bc4j" level="INFO"/>
      <logger name="oracle.adf.portal" level="INFO"/>
      <logger name="oracle.vcr" level="INFO"/>
      <logger name="oracle.portlet" level="INFO"/>
      <logger name="oracle.adfinternal" level="INFO"/>
      <logger name="oracle.adfdt" level="INFO"/>
      <logger name="oracle.adfdtinternal" level="INFO"/>
   </loggers>
</logging_configuration>
For the latest information about the different levels of the Java Logging system, go to http://www.oracle.com/technetwork/java/index.html. Normally, the Java logging system supports the following levels:
-
SEVERE
-
WARNING
-
INFO
-
CONFIG
-
FINE
-
FINER
-
FINEST
36.6.6 What You May Need to Know About ADF Logging and Oracle WebLogic Server
After you have deployed the Fusion web application to Oracle WebLogic Server, the operations performed by the application are logged directly to the Managed Server where the application is running:
DOMAIN_HOME/servers/server_name/logs/server_name-diagnostic.log
The log files for the different Managed Servers are also available from the Oracle WebLogic Server Administration Console. To verify the logs, access the Oracle WebLogic Server Administration Console http://<admin_server_host>:<port>/console and click Diagnostics-Log Files.
This log's granularity and logging properties can be changed using Oracle Enterprise Manager Fusion Middleware Control (Fusion Middleware Control). Fusion Middleware Control is a web browser-based, graphical user interface that you can use to monitor and administer a farm.
When the Fusion web application is deployed to a high availability environment, you can receive warning diagnostic messages specific to high availability by setting the level to FINE.
For details about using Fusion Middleware Control to change the log settings of Managed Servers and Oracle ADF, see the Oracle Fusion Middleware Administrator's Guide.
36.7 Using the Oracle ADF Model Tester for Testing and Debugging
The Oracle ADF Model Tester (also referred to as the tester) is a Java application that you launch from JDeveloper when you want to interact with the business objects of the ADF Business Components data model project. The Oracle ADF Model Tester runs outside of JDeveloper and provides a full UI for testing and examining the data model project. You can run the tester to examine the view instances of the ADF application module, navigate the hierarchical relationship of view links, and execute custom methods from the application module's client interface, view object interface, and view row interface. The tester also interacts with the ADF Declarative Debugger to allow you to set breakpoints on the custom methods of these interfaces.
Additionally, the tester simulates many features that the user interface might expose by allowing you to view, insert, and update the contents of business objects in the database specified by the application module's configuration file (bc4j.xcfg). Specifically, you can use the tester to verify many aspects of the data model design, including master-detail relationships between view instance, view instances and their attributes, view instance query result sets, search forms using view criteria, validation rules defined for attribute values, and dropdown lists on LOV-defined attributes (list of values). For more information about ways to interact with the tester to test your business objects, see Section 6.3, "Testing View Object Instances Using the Oracle ADF Model Tester." Additional information about testing with the Oracle ADF Model Tester also appears in sections specific to each business object throughout the chapters in the "Building Your Business Services" part of this book.
36.7.1 How to Run in Debug Mode and Test with the Oracle ADF Model Tester
Often you will find it useful to analyze and debug custom code in the service methods of your client interface implementation classes. When you use the Oracle ADF Model Tester, you can do this without needing to run the application with the user interface. You can use the Oracle ADF Model Tester as a testing tool to complement your debugging process.
Caution:
The Oracle ADF Model Tester that you run in debug mode will not inherit your JDeveloper IDE Java options. To ensure that specific run/debug Java options are used with the tester, you must edit the run configuration for the data model project. You can modify the default run confirmation in the Run/Debug page of the Project Properties dialog.
You will need to complete these tasks:
-
Set the desired Java options for your preferred run configuration, as described in the "Running and Debugging Java Programs" chapter in Oracle Fusion Middleware Web User Interface Developer's Guide for Oracle Application Development Framework.
-
Set breakpoints in the custom methods of your client interface, as described in Section 36.9, "Setting ADF Declarative Breakpoints."
To launch the Oracle ADF Model Tester and go into debug mode:
-
In the Application Navigator, right-click the desired application module and choose Debug.
-
In the Oracle ADF Model Tester, open the method testing panel for the desired client interface, as described in Section 9.9.4, "How to Test Custom Service Methods Using the Oracle ADF Model Tester."
-
In the method panel, select the desired method from the dropdown list, enter values to pass as method parameters, and click Execute.
Return to JDeveloper to step through your code using the ADF Declarative Debugger. When you complete method execution, the method panel displays the return value (if any) and test result. The result displayed in the Oracle ADF Model Tester will indicate whether or not the method executed successfully.
36.7.2 How to Run the Oracle ADF Model Tester and Test with a Specific Configuration
When you right-click the application module in the Application Navigator and choose Run or Debug, JDeveloper will run the Oracle ADF Model Tester using the default configuration defined for the application module. If you want to test your business components with a different application module configuration (which can specify a different data source and its own set of runtime parameters), you can do so from the Configurations page in the overview editor for the application module.
To run the Oracle ADF Model Tester with a specific configuration:
-
In the Application Navigator, double-click the application module that you want to test.
-
In the overview editor, click the Configurations navigation tab, and select the configuration from the list.
Although the metadata changes that you make are not involved in compiling the project, the compile step is necessary to copy the metadata to the class path and to allow the Oracle ADF Model Tester to reload it.
-
Right-click the selected configuration and choose Run or Debug to launch the Oracle ADF Model Tester.
36.7.3 What Happens When You Run the Oracle ADF Model Tester in Debug Mode
The Oracle ADF Model Tester behaves as any other Java program. Specifically, it does not inherit Java options that you may have specified for the JDeveloper IDE. The tester instead uses the run configuration that you have specified for the data model project and any Java options that you may have set in that configuration.
JDeveloper lets you run the Oracle ADF Model Tester in two modes: either in debug mode or non-debug mode. When run in debug mode, the tester interacts with the ADF Declarative Debugger so that you execute custom methods using breakpoints you insert in custom code of the client interfaces. For instance, if you set a breakpoint on a method in the client interface and execute that method in the tester, then in debug mode, you can step through the code before the tester returns a success/fail result. In non-debug mode, the tester will immediately return a result to indicate whether the method executed successfully. Additionally, in either debug or non-debug mode, the tester can display runtime artifacts from the system catalog created at runtime for the application module.
36.7.4 How to Verify Runtime Artifacts in the Oracle ADF Model Tester
When you want to run the Oracle ADF Model Tester, but do not require the use of the ADF Declarative Debugger you can display information about the runtime artifacts from the application module's system catalog. The system catalog displays business object metadata and other information that you may find useful when you need to compare business objects.
To launch the Oracle ADF Model Tester without debugging:
-
In the Application Navigator, right-click the desired application module and choose Run.
-
In the Oracle ADF Model Tester, choose Create - Create SysCat AM.
-
In the data model tree, expand the SysCatAMDefs, right-click ViewDefs, and choose Show Table.
-
In the data viewer, scroll vertically to locate the desired view instance in the SCName (system catalog name) field.
Exposing the system catalog in the tester allows access to metadata and other information specific to the runtime objects without running the debugger. For example, you can check whether a view instance has a custom Java implementation class or not.
36.7.5 How to Refresh the Oracle ADF Model Tester with Application Changes
The Oracle ADF Model Tester is a highly interactive tool. When you run the tester and determine a change is needed in the data model project, you can return to JDeveloper to edit the desired application module instances and refresh the Oracle ADF Model Tester data model to display the changes. This way you can verify your changes without needing to rerun the tester.
To reload application metadata in the Oracle ADF Model Tester:
-
In the data model project, edit your business objects and save the changes in the JDeveloper.
-
In the Application Navigator, recompile the data model project. For example, you can right-click the data model project in the Application Navigator and choose Make to complete the recompile step.
Although the metadata changes that you make are not involved in compiling the project, the compile step is necessary to copy the metadata to the class path and to allow the Oracle ADF Model Tester to reload it.
-
In the Oracle ADF Model Tester, in the toolbar, click Reload application metadata.
Alternatively, you can choose Reload Application from the File menu of the Oracle ADF Model Tester.
36.8 Using the ADF Declarative Debugger
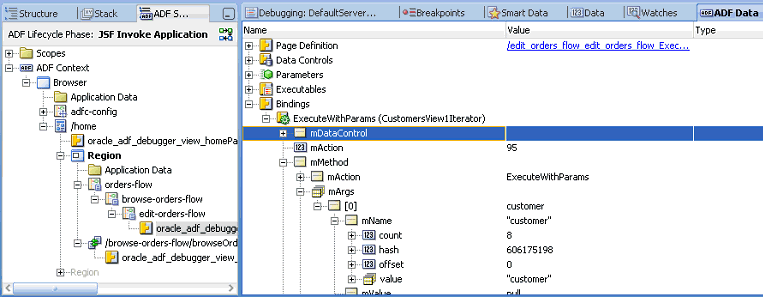
The ADF Declarative Debugger provides declarative breakpoints that you can set at the ADF object level (such as task flows, page definition executables, method and action bindings, ADF lifecycle phases), as well as standard Java breakpoints. ADF declarative breakpoints provide a high-level object view for debugging ADF applications. For example, you can break before a task flow activity to see what parameters would be passed to the task flow, as shown in Figure 36-11. To perform the same function using only Java breakpoints would require you to know which class or method to place the breakpoint in. ADF declarative breakpoints should be the first choice for ADF applications.
The ADF Declarative Debugger also supports standard Java code breakpoints. You can set Java code breakpoints in any ADF application. You may be able to use Java code breakpoints when an ADF declarative breakpoint does not break in the place you want.
The ADF Declarative Debugger is built on top of the Java debugger, so it has the features and behaviors of the Java debugger. But instead of needing to know the Java class or method, you can set ADF declarative breakpoints in visual editors.
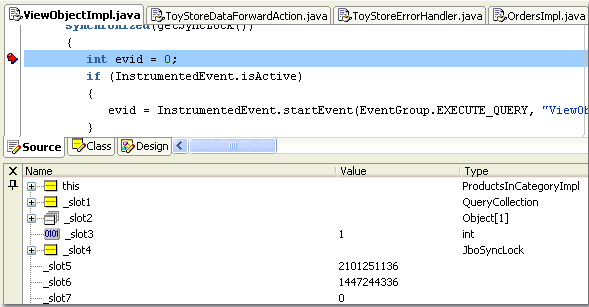
The ADF Declarative Debugger provides standard debugging features such as the ability to examine variable and stack data. When an application pauses at any breakpoint (ADF Declarative or Java code breakpoint), you can examine the application status using a variety of windows. You can check where the break occurs in the Breakpoints window. You can check the call stack for the current thread using the Stack window. When you select a line in the Stack window, information in the Data window, Watches window, and all Inspector windows is updated to show relevant data. You can use the Data window to display information about arguments, local variables, and static fields in your application.
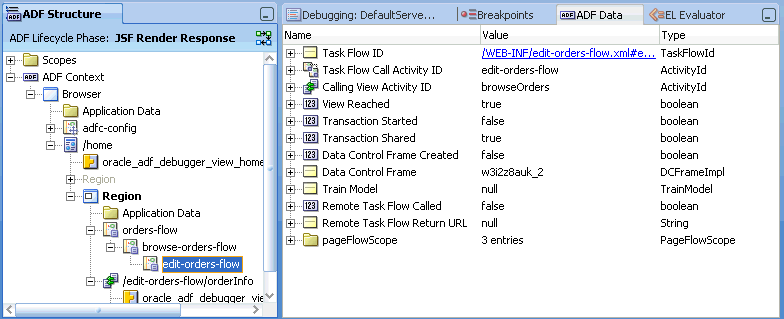
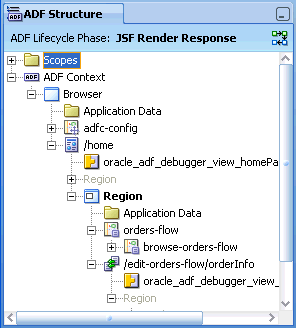
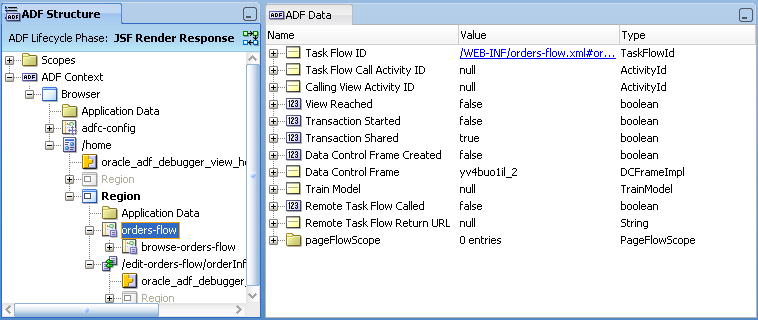
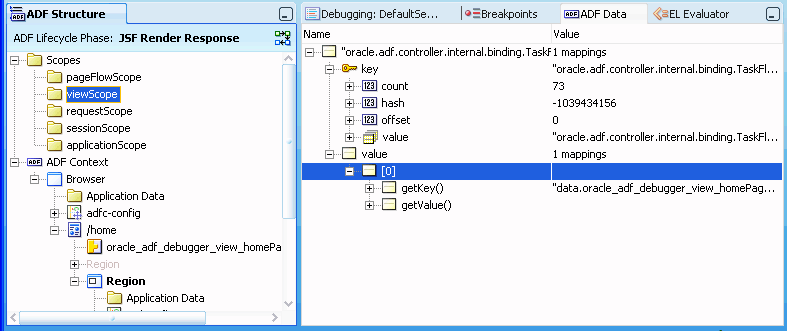
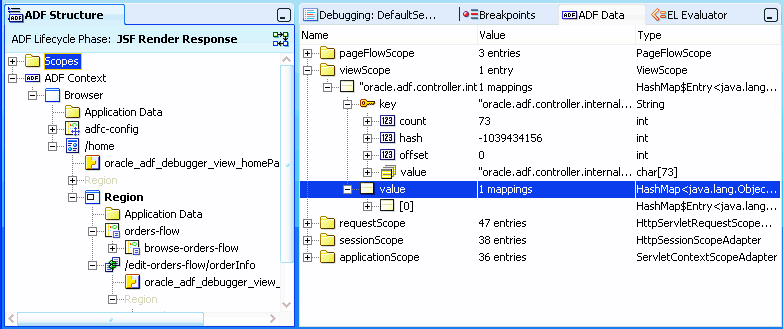
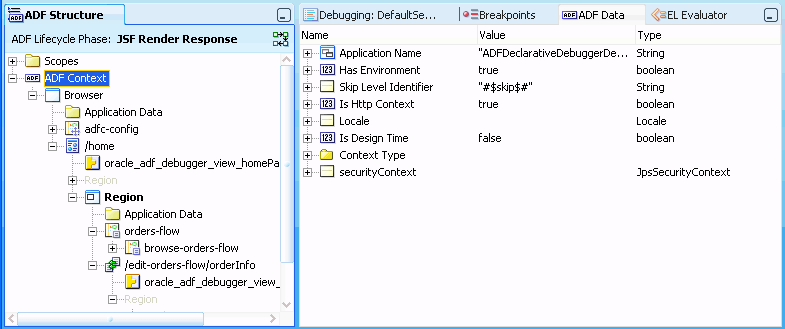
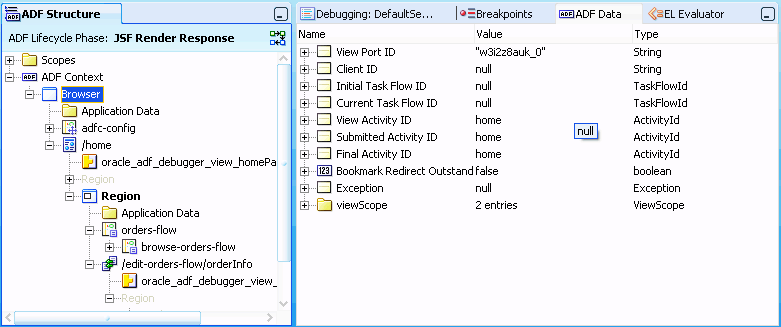
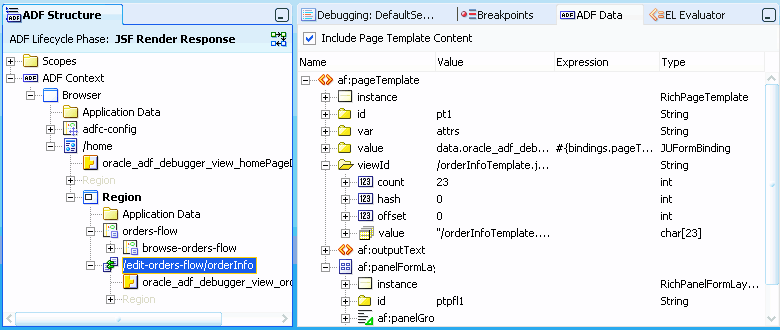
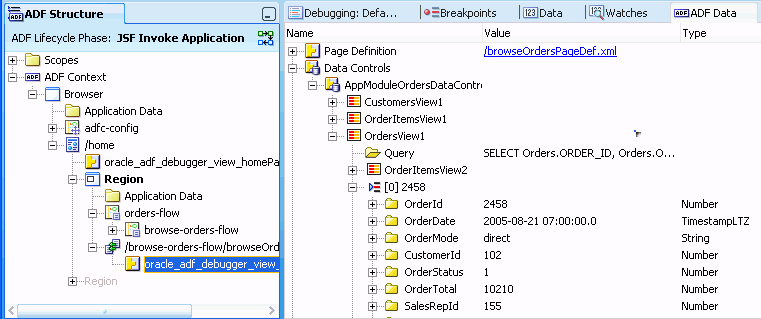
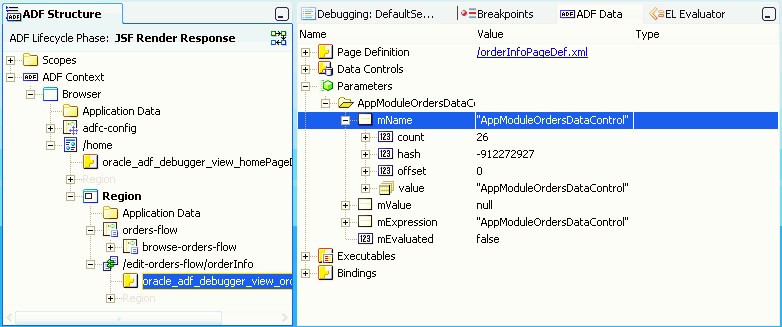
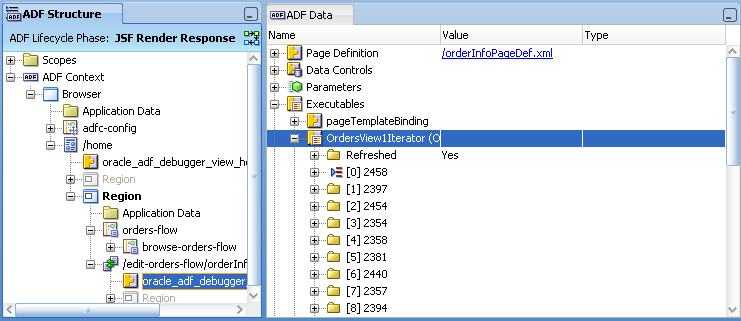
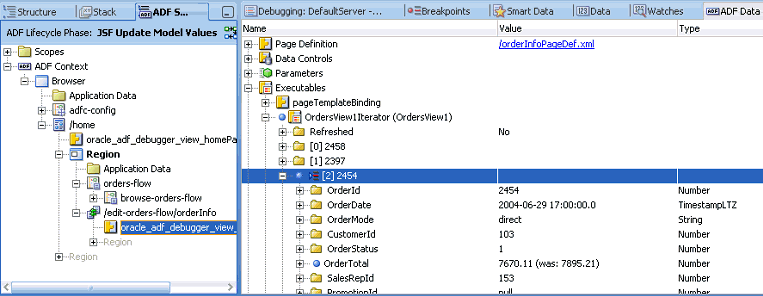
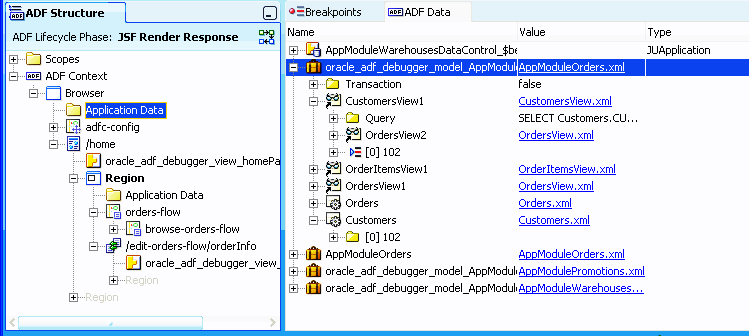
The ADF Structure window displays the runtime structure of the project. The ADF Data window automatically changes its display information based on the selection in the ADF Structure window. For example, if a task flow node is selected, the ADF Data window displays the relevant debugging information for task flows, as shown in Figure 36-12.
You can mix ADF declarative breakpoints with Java code breakpoints as needed in your debugging session. Although you can use step functions to advance the application from Java code breakpoint to Java code breakpoint, the step functions for ADF declarative breakpoints have more constraints and limitations. For more information about using step functions on ADF declarative breakpoints, see Table 36-3.
For information on how to use ADF declarative breakpoints, see Section 36.9, "Setting ADF Declarative Breakpoints."
For information on how to use Java breakpoints on classes and methods, see Section 36.10, "Setting Java Code Breakpoints."
In a JSF application (including Fusion web applications), when a breakpoint breaks, you can use the EL Evaluator to examine the value of an EL expression. The EL Evaluator has the browse function that helps you select the correct expression to evaluate. For more information, see Section 36.8.4, "How to Use the EL Expression Evaluator."
Whether you plan to use ADF declarative breakpoints or Java breakpoints, you can use the ADF Declarative Debugger with Oracle ADF source code. You can obtain Oracle ADF source code with Debug libraries. For more information about loading source code. see Section 36.8.1, "Using ADF Source Code with the Debugger."
36.8.1 Using ADF Source Code with the Debugger
If you have valid Oracle ADF support, you can obtain complete source code for Oracle ADF by opening a service request with Oracle Worldwide Support. You can request a specific version of the Oracle ADF source code. You may be given download and password information to decrypt the source code ZIP file. Contact Oracle Worldwide Support for more information.
Adding Oracle ADF source code access to your application debugging session will:
-
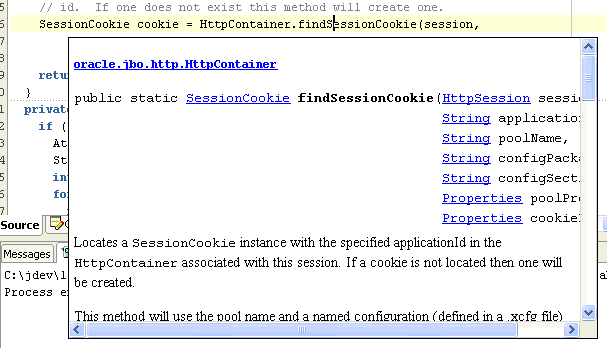
Provide access to the JDeveloper Quick Javadoc feature in the source editor. Without the source code, you will have only standard Javadoc.
-
Enhance the use of Java code breakpoints by displaying the Oracle source code that's being executed when the breakpoint is encountered. You can also set breakpoints easier by clicking on the margin in the source code line you want to break on. Without the source code, you will have to know the class, method, or line number in order to set a breakpoint within Oracle code.
-
For Java code breakpoints set within the source code, you will be able to see the values of all local variables and member fields in the debugger.
The ADF source code ZIP file may be delivered within an encrypted "outer" ZIP file to protect its contents during delivery. The "outer" ZIP name is sometimes a variant of the service request number.
After you have received or downloaded the "outer" ZIP, unzip it with the provided password to access the actual source code ZIP file. The ADF source code ZIP name should be a variant of the ADF version number and build number. For example, the ADF source ZIP may have a format similar to adf_vvvv_nnnn_source.zip, where vvvv is the version number and nnnn is the build number.
After you have access to the source code ZIP, extract its contents to a working directory.
36.8.2 How to Set Up the ADF Source User Library
You create a name for the source user library and then associate that name with the source zip file.
To add the ADF source zip file to the user library
-
From the main menu, choose Tools > Manage Libraries.
-
In the Manage Libraries dialog, with the Libraries tab selected, click New.
-
In the Create Library window, enter a library name for the source that identifies the type of library.
-
Select the Source Path node in the tree structure. Click Add Entry.
Note:
Do not enter a value for the class path. You need to provide a value only for the source path.
-
In the Select Path Entry window, browse to the directory where the file was extracted and select the source zip file. Click Select.
-
In the Create Library window, verify that the source path entry has the correct path to the source zip file, and deselect Deployed by Default. Click OK.
-
Click OK.
36.8.3 How to Add the ADF Source Library to a Project
After the source library has been added to the list of available user libraries, add it to the project you want to debug.
To add the ADF source zip file to the project:
-
In the Application Navigator, double-click the project or right-click the project and select Project Properties.
-
In the Project Properties dialog, select Libraries and Classpaths.
-
Click Add Library.
-
In the Add Library dialog, under the Users node, select the source library you want to add and click OK.
The source library should appear in the Classpath Entries section in the Project Properties dialog.
-
Click OK.
36.8.4 How to Use the EL Expression Evaluator
When the application is paused at a breakpoint, you can use the EL expression evaluator to enter an EL expression for evaluation. You can enter arbitrary EL expressions for evaluation within the current context. If the EL expression no longer applies within the current context, the value will be evaluated to null.
The EL Evaluator is different from the Watches window in that EL evaluation occurs only when stopped at a breakpoint, not when stopped at subsequent debugging steps.
The EL Evaluator is available for debugging any JSF application.
Caution:
Be wary when you are evaluating EL expressions that you do not indirectly change application data and therefore the behavior of the application. For example, if you evaluate #{foo.bar}, the corresponding getBar() method modifies application data.
-
Set a breakpoint in the application.
The application must be a JSF application. It does not need to be an ADF application.
-
Start the debugging process.
You can:
-
From the main menu, choose Run > Debug.
-
From the Application Navigator, right-click the project,
adfc-config.xml,faces-config.xml, task flow, or page and choose Debug. -
From the task flow diagrammer, right-click an activity and choose Debug. Only task flows that do not use page fragments can be run.
-
-
When the breakpoint is reached, the EL Evaluator should appear as a tab in the debugger window area. Click the EL Evaluator tab to bring it forward. If it does not appear, choose View > Debugger > EL Evaluator from the main menu.
Note:
Be sure that the application has actually hit a breakpoint by checking the Breakpoints window or checking that there is an Execution Point icon (red right arrow) next to the breakpoint. Depending on where you set the breakpoint, an application may appear to be stopped when in fact it is waiting for user input at the page.
-
Enter an EL expression in the input field.
When you click in the field after entering
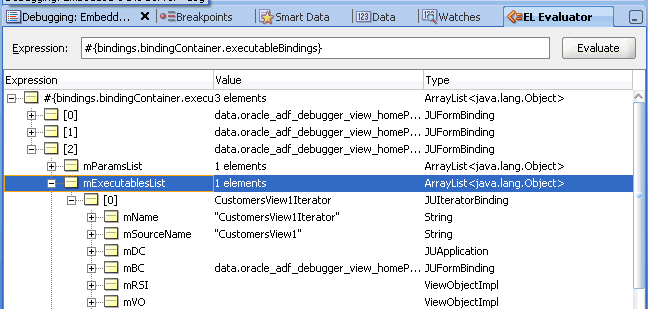
#{or after a period, a discovery function provides a selectable list of expression items, as shown in Figure 36-13. Auto-completion will be provided for easy entry. You can evaluate several EL expressions at the same time by separating them with semicolons. -
When you finish entering the EL expression, click Evaluate and the expression is evaluated, as shown in Figure 36-14.
36.8.5 How to View and Export Stack Trace Information
If you are unable to determine what the problem is and to resolve it yourself, typically your next step is to ask someone else for assistance. Whether you post a question in the OTN JDeveloper Discussion Forum or open a service request on Metalink, including the stack trace information in your posting is extremely useful to anyone who will need to assist you further to understand exactly where the problem is occurring.
JDeveloper's Stack window makes communicating this information easy. Whenever the debugger is paused, you can view the Stack window to see the program flow as a stack of method calls that got you to the current line. Right-click the Stack window background and choose Preferences. You can set the Stack window preference to include the line number information, as well as the class and method name that will be there by default. Finally, the context menu option Export lets you save the current stack information to an external text file whose contents you can then post or send to whomever might need to help you diagnose the problem.
36.9 Setting ADF Declarative Breakpoints
You use the ADF Declarative Debugger features in JDeveloper to declaratively set breakpoints on ADF task flow activities, page definition executables, method, action, and value bindings, ADF Lifecycle phases, and contextual events. Instead of needing to know all the internal constructs of the ADF code, such as method names and class names, you can set breakpoints at the highest level of object abstraction.
You can add breakpoints to task flow activities in the task flow diagrammer or you can launch the Create ADF Task Flow Activity Breakpoint dialog from the Breakpoints window. In the task flow diagrammer, you can select a task flow activity and use the context menu to toggle or disable breakpoints on that activity, or press the F5 button. After the application pauses at the breakpoint, you can view the runtime structure of the objects in the ADF Structure window as a tree structure. The ADF Data window displays a list of data for a given object selected in the ADF Structure window.
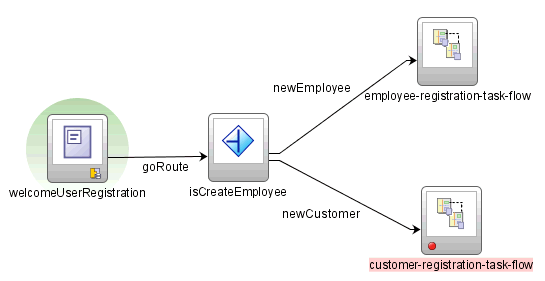
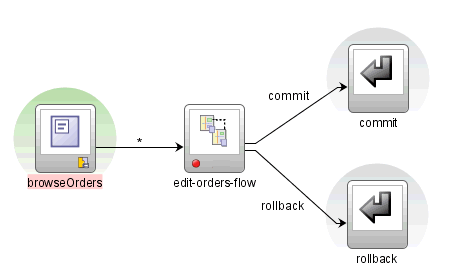
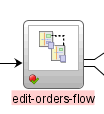
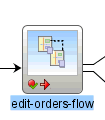
For example, when you set a breakpoint on a task flow call activity in the Browse Orders task flow, a red dot icon appears in the call activity, as shown in Figure 36-15.
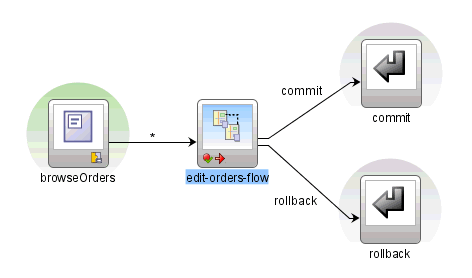
When the breakpoint is reached, the application is paused and the icon changes, as shown in Figure 36-16.
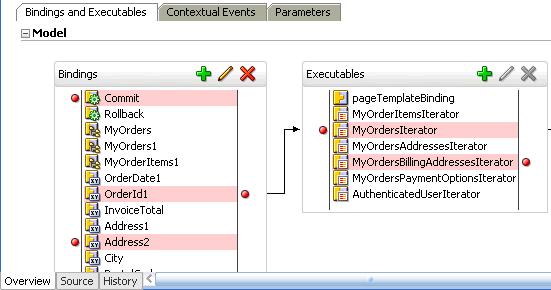
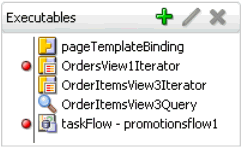
Similarly, you can set Before and After breakpoints in the page definition file. You set breakpoints for supported value bindings (see Table 36-1 for the list of supported value binding) and for executables by clicking on the left or right margin next to the item or by selecting from the context menu. Clicking on the left margin adds a Before page definition breakpoint, and clicking on the right margin adds an After page definition breakpoint. Again, a red dot icon that indicates the breakpoint is set, as shown in Figure 36-17.
The page definition file also lets you set breakpoints on contextual events that your page or region within a page raises at runtime, as shown in Figure 36-18.
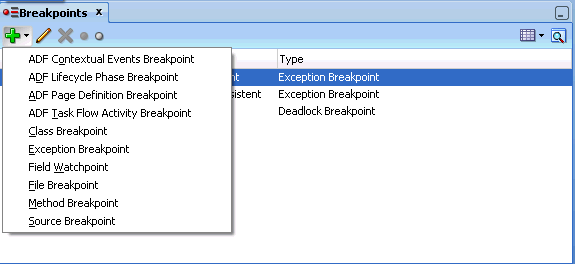
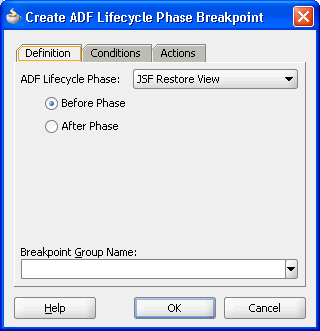
You can also set Before and After breakpoints on all the ADF lifecycle phases. You can launch the Create ADF Lifecycle Phase Breakpoint dialog from the Breakpoints window, as shown in Figure 36-19.
The Create ADF Lifecycle Phase Breakpoint dialog allows you to select different lifecycle breakpoint options, as shown in Figure 36-20.
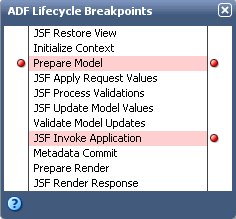
Alternatively, you can use the ADF Lifecycle Breakpoints dialog from the ADF Structure window or the task flow diagrammer to set ADF lifecycle phase breakpoints. For more information about ADF lifecycle phases, see Chapter 25, "Understanding the Fusion Page Lifecycle."
You can define both ADF declarative breakpoints and standard Java code breakpoints when using the ADF Declarative Debugger. Depending on your debugging scenario, you may only need to use the declarative breakpoints to debug the application. Or you may find it necessary to add additional breakpoints in Java code that are not available declaratively. For information on Java code breakpoints, see Section 36.10.1, "How to Set Java Breakpoints on Classes and Methods." Table 36-1 lists the available ADF Declarative Debugger breakpoint locations.
Table 36-1 ADF Declarative Debugger Breakpoints
| ADF Area | Declarative Breakpoint | JDeveloper Editor | JDeveloper Location | JDeveloper Context Menu Command | Description |
|---|---|---|---|---|---|
|
ADF lifecycle phase |
Before ADF lifecycle phase After ADF lifecycle phase |
ADF Structure window Task flow diagrammer Breakpoints window |
ADF Structure window ADF Lifecycle Breakpoints toolbar button Task flow diagrammer Breakpoints window Add button |
A Before breakpoint pauses debugging before the ADF lifecycle phase. An After breakpoint pauses debugging after the ADF lifecycle phase. The ADF lifecycle JSF Render Response and Prepare Render phase Before and After breakpoints are executed in the following order:
|
|
|
ADF page definition - bindings and executables |
Before/After executable:
|
Overview editor for page definition files |
Page Definition Bindings and Executables tab, Executables section Breakpoints window Add button |
Toggle Breakpoint or F5 Disable Breakpoint |
Pauses debugging before or after executable is refreshed. For task flow bindings, this represents two times per lifecycle: first, during |
|
Before/After action binding:
|
Page Definition Bindings and Executables tab, Bindings section Breakpoints window Add button |
Toggle Breakpoint or F5 Disable Breakpoint |
Pauses debugging before or after binding is executed. |
||
|
Before/After attribute value binding |
Page Definition Bindings and Executables tab, Bindings section Breakpoints window Add button |
Toggle Breakpoint or F5 Disable Breakpoint |
Pauses debugging before or after the attribute's |
||
|
Before/After table binding |
Page Definition Bindings and Executables tab, Bindings section Breakpoints window Add button |
Toggle Breakpoint or F5 Disable Breakpoint |
Pauses debugging before or after the ADF hierarchical binding's |
||
|
Before/After tree binding |
Page Definition Bindings and Executables tab, Bindings section Breakpoints window Add button |
Toggle Breakpoint or F5 Disable Breakpoint |
Pauses in either of these two cases: 1. When making a node selection in the tree, pauses debugging before or after the ADF hierarchical binding's 2. When expanding the tree, pauses debugging before or after the ADF tree collection model's |
||
|
ADF page definition - contextual events |
Before/After contextual events |
Page definition overview editor |
Page Definition Contextual Events tab, Events section Breakpoints window Add button |
Toggle Breakpoint or F5 Disable Breakpoint |
Pauses debugging either before the event is dispatched or after the event, just before the event is consumed by a subscriber to the event. |
|
ADF task flow |
Before activity |
Task flow diagrammer |
Task flow diagrammer Breakpoints window Add button |
Toggle Breakpoint or F5 Disable Breakpoint |
Pauses debugging before the activity executes within the JSF Invoke Application phase. The activity where the declarative breakpoint is defined has not yet been executed. An exception are view activities; they pause within the JSF Render Response phase after the view activity is executed, but before the new page is rendered. By pausing at that point, the view activity values can be inspected using the ADF Structure and ADF Data windows. |
The ADF Declarative Debugger uses the standard debugger icons and notations for setting, toggling, and indicating the status of ADF declarative breakpoints.
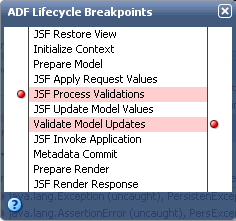
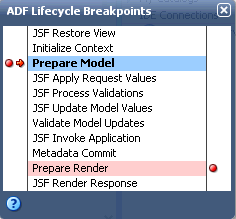
When an ADF declarative breakpoint is set, it appears as a red dot icon in the task flow activity, in the page definition breakpoint margins, or in the ADF Lifecycle Breakpoints window, as shown in Figure 36-21, Figure 36-22, Figure 36-23, and Figure 36-24.
When an ADF task flow or page definition declarative breakpoint is disabled, the red icon becomes a gray icon, as shown in Figure 36-25.
When an ADF task flow declarative breakpoint is active, the red dot icon has a green checkmark, as shown in Figure 36-26.
When the application is paused at an ADF declarative breakpoint, an Execution Point icon appears, as shown in Figure 36-27.
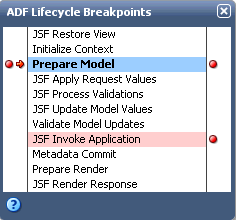
When the application is paused at an ADF lifecycle declarative breakpoint, an Execution Point icon appears next to the lifecycle phase in the ADF Lifecycle Breakpoints window, as shown in Figure 36-28. The name of the current ADF lifecycle phase is also displayed in the ADF Structure window.
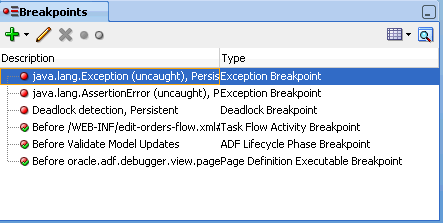
The Breakpoints window list all breakpoints, including ADF declarative breakpoints, as shown in Figure 36-29.
The Breakpoints window has a toolbar that includes buttons to add, edit, delete, enable, and disable breakpoints, as shown in Figure 36-29. The Add Breakpoint icon dropdown menu includes functions to create and manage ADF contextual events breakpoints, ADF lifecycle phase breakpoints, ADF page definition breakpoints (for ADF bindings and executables), ADF task flow activity breakpoints, and standard Java code breakpoints.
You can use the Breakpoints window to view the location of the ADF declarative breakpoint in its corresponding source file:
-
Double-click a contextual event breakpoint to open the overview editor for the corresponding page definition file. You can then click the Contextual Events tab to view the location of the breakpoint.
-
Double-click an ADF lifecycle phase breakpoint to open the ADF Lifecycle Breakpoints window which displays all ADF lifecycle execution points.
-
Double-click a task flow activity breakpoint to open the task flow diagrammer for the corresponding task flow.
-
Double-click an ADF binding breakpoint to open the overview editor for the corresponding page definition file.
To manage how the debugger handles a breakpoint, you can open the Edit ADF Breakpoint dialog for individual breakpoints that appear in the Breakpoints window. Or, you can select multiple ADF declarative breakpoints and customize the behavior of their common fields.
Table 36-2 lists how an ADF declarative breakpoint will appear in the Breakpoints window under the Description and Type columns.
Table 36-2 Breakpoints Window Display of ADF Declarative Breakpoints
| Declarative Breakpoint Type | Description Column | Type Column |
|---|---|---|
|
Before/After contextual event |
Before page definition@event name After page definition@event name |
Contextual events breakpoint |
|
Before ADF lifecycle phase |
Before adf lifecycle phase |
ADF lifecycle phase breakpoint |
|
After ADF lifecycle phase |
After adf lifecycle phase |
ADF lifecycle phase breakpoint |
|
Before/After page definition executable:
|
Before page definition@executable id After page definition@executable id |
Page definition executable breakpoint |
|
Before/After page definition action binding:
|
Before page definition@binding id After page definition@binding id |
Page definition binding breakpoint |
|
Before/After page definition attribute value binding |
Before page definition@binding id After page definition@binding id |
Page definition binding breakpoint |
|
Before/After page definition table binding |
Before page definition@binding id After page definition@binding id |
Page definition binding breakpoint |
|
Before/After page definition tree binding |
Before page definition@binding id After page definition@binding id |
Page definition binding breakpoint |
|
Before ADF task flow activity |
Before task flow document#task flow id@activity id |
Task flow activity breakpoint |
Table 36-3 lists the step commands that can be used with ADF declarative breakpoints.
Table 36-3 ADF Declarative Debugger Step Commands
| ADF Debugger Step Commands | Description |
|---|---|
|
Find Execution Point |
Supported for declarative breakpoints to display the current execution point open and active within the corresponding editor. |
|
Step Over (F8) |
Supported for task flow activity declarative breakpoints to step from activity to activity within a task flow. If user interaction is required (for example, page displayed), once it is received (for example, button selected), processing will resume and then will pause before the next task flow activity. supported for page definition executable breakpoints. The application will step to the next page definition executable breakpoint. Supported for ADF lifecycle phase declarative breakpoints to step to the next Before or After ADF lifecycle phase location. |
|
Step Into (F7) |
Supported only for task flow activity declarative breakpoints defined on task flow call activities. Task flow activity declarative breakpoints pause the application just before the activity is executed. The Step Into function provides the ability to pause debugging just prior to executing the called task flow default activity. This action would be the same as placing a task flow activity declarative breakpoint on the called task flow default activity. |
|
Step Out (Shift F7) |
Supported for task flow activity declarative breakpoints to step out of the current called task flow and back into the caller (if any). If user interaction is required (for example, page displayed) once user interaction received (for example, button selected), processing will resume and will pause before the next user interaction or activity within the calling task flow. |
|
Continue Step (Shift F8) |
Not supported for declarative breakpoints. |
|
Step to End of Method |
Not supported for declarative breakpoints. |
|
Run to Cursor |
Not supported for declarative breakpoints. |
|
Pop Frame |
Not supported for declarative breakpoints, as it is for Java code, to return to a previous point of execution. |
36.9.1 How to Set and Use Task Flow Activity Breakpoints
After you have created a task flow diagram, you can set ADF declarative breakpoints on task flow activities.
To set a breakpoint on a task flow activity:
-
Open the task flow in the task flow diagrammer, or from the Breakpoints window, click the Add icon and select ADF Task Flow Activity Breakpoint.
-
Set the task flow activity breakpoint.
-
If you use the task flow diagrammer, right-click and choose Toggle Breakpoint from the context menu, or press F5.
A breakpoint icon appears on the task flow activity.
-
If you launched the Create ADF Task Flow Activity Breakpoint dialog from the Breakpoints window, click Browse to select a task flow definition, select the task flow from the Task Flow dropdown list, select the task flow activity from the Activity dropdown list, and click OK.
-
-
Optionally, configure a breakpoint's settings to manage the debugger:
-
Choose View > Breakpoints to open the Breakpoints window.
-
Select the task flow activity breakpoint you want to configure and click the Edit icon.
-
In the Edit ADF Task Flow Activity Breakpoint dialog, click the Conditions tab, specify the conditions which apply to the breakpoint. The conditions must be valid for the breakpoint to occur.
-
Click the Actions tab, specify the actions that you want the debugger to take when the breakpoint occurs and click OK.
For example, the usual action for a breakpoint is to halt the program you are debugging, but you may want the debugger to beep and log information to the Log window without halting the program.
-
-
Start the debugging process.
You can:
-
From the main menu, choose Run > Debug.
-
From the Application Navigator, right-click the project,
adfc-config.xml,faces-config.xml, task flow, or page and choose Debug. -
From the task flow diagrammer, right-click an activity and choose Debug. Only task flows that do not use page fragments can be run.
-
-
When the application is paused at a breakpoint, an Execution Point icon appears next to the breakpoint icon on the task flow activity. You can examine the application using different debugger windows.
Note:
Be sure that the application has actually hit a breakpoint by checking the Breakpoints window or checking that there is an Execution Point icon (red right arrow) next to the breakpoint. Depending on where you set the breakpoint, an application may appear to be stopped when in fact it is waiting for user input at the page.
The application is paused before the task flow activity executes (except for view activities).
-
The ADF Structure window and the ADF Data window appear by default, as well as several debugger windows. You can examine the runtime structure in the ADF Structure window and its corresponding data in the ADF Data window. See Section 36.9.7, "How to Use the ADF Structure Window," and Section 36.9.8, "How to Use the ADF Data Window."
-
Select a node in the ADF Structure window and view pertinent information in the ADF Data window. Task flow activity declarative breakpoints pause the application just before the task flow activity is executed. You can use the Step Into (F7) function to pause the application just prior to executing the called task flow default activity.
-
Continue debugging the application as required, using the step functions as described in Table 36-3. The key step function is Step Into (F7).
When the application is paused, you can remove or disable existing breakpoints and set new breakpoints.
36.9.2 How to Set and Use Page Definition Executable Breakpoints
If your page definition has executables, you can set breakpoints to pause the application before or after these executables. For example, you can set breakpoints to pause the application when iterators are refreshed or when invokeAction methods are performed.
Note:
If you are setting an After iterator breakpoint to pause the application after a view object query has been executed, be aware that the application may pause at this breakpoint multiple times. Also be aware that it may pause at this breakpoint even when the query has not been executed. If you need to know whether the query has been executed, select the relevant ADF Business Components in the ADF Structure window and view their corresponding data in the ADF Data window. For more information on how to use these windows, see Section 36.9.7, "How to Use the ADF Structure Window," and Section 36.9.8, "How to Use the ADF Data Window."
For more information about using Java code breakpoints on view object query execution, see Section 36.10.8, "How to Use Common Oracle ADF Breakpoints."
To set a breakpoint on an executable in the page definition file:
-
In the Application Navigator, double-click the page definition file that contains the executable in which you want to set a breakpoint.
-
In the overview editor, click the Bindings and Executables tab, select an executable from the Executables list, and click in the breakpoint margin to the left of the item.
A breakpoint icon appears in the margin next to the item.
-
Optionally, configure a breakpoint's settings to manage the debugger:
-
Choose View > Breakpoints to open the Breakpoints window.
-
Select the executable breakpoint you want to configure and click the Edit icon.
-
In the Edit ADF Page Definition Binding Breakpoint dialog, click the Conditions tab, specify the conditions which apply to the breakpoint. The conditions must be valid for the breakpoint to occur.
-
Click the Actions tab, specify the actions that you want the debugger to take when the breakpoint occurs and click OK.
For example, the usual action for a breakpoint is to halt the program you are debugging, but you may want the debugger to beep and log information to the Log window without halting the program.
-
-
Start the debugging process.
You can:
-
From the main menu, choose Run > Debug.
-
From the Application Navigator, right-click the project,
adfc-config.xml,faces-config.xml, task flow, or page and choose Debug. -
From the task flow diagrammer, right-click an activity and choose Debug. Only task flows that do not use page fragments can be run.
-
-
When the application is paused at a breakpoint, an Execution Point icon appears in the margin next to the breakpoint icon of the executable item. You can examine the application using several debugger windows.
The application pauses when the executable binding is refreshed. If this is a taskFlow executable, the pause occurs in the
prepareModeland theprepareRenderlifecycles.Note:
Be sure that the application has actually hit a breakpoint by checking the Breakpoints window or checking that there is an Executable Point icon (red right arrow) next to the breakpoint. Depending on where you set the breakpoint, an application may appear to be stopped when in fact it is waiting for user input at the page.
-
The ADF Structure window and the ADF Data window appear by default, as well as several debugger windows. You can examine the runtime structure in the ADF Structure window and its corresponding data in the ADF Data window. See Section 36.9.7, "How to Use the ADF Structure Window," and Section 36.9.8, "How to Use the ADF Data Window."
-
Select a node in the ADF Structure window and view pertinent information in the ADF Data window.
-
When the application is paused, you can remove or disable existing breakpoints and set new breakpoints.
36.9.3 How to Set and Use Page Definition Action Binding Breakpoints
You can set breakpoints in the page definition file on action bindings and methodAction bindings. The application pauses when the binding is executed.
To set a breakpoint on an action binding in the page definition file:
-
In the Application Navigator, double-click the page definition file that contains the binding in which you want to set a breakpoint.
-
In the overview editor, click the Bindings and Executables tab, select a
methodActionbinding or built-in operation item from the Bindings list, and click in the breakpoint margin to the left of the item.A breakpoint icon appears next to the item.
-
Optionally, configure a breakpoint's settings to manage the debugger:
-
Choose View > Breakpoints to open the Breakpoints window.
-
Select the action binding breakpoint you want to configure and click the Edit icon.
-
In the Edit ADF Page Definition Binding Breakpoint dialog, click the Conditions tab, specify the conditions which apply to the breakpoint. The conditions must be valid for the breakpoint to occur.
-
Click the Actions tab, specify the actions that you want the debugger to take when the breakpoint occurs and click OK.
For example, the usual action for a breakpoint is to halt the program you are debugging, but you may want the debugger to beep and log information to the Log window without halting the program.
-
-
Start the debugging process.
You can:
-
From the main menu, choose Run > Debug.
-
From the Application Navigator, right-click the project,
adfc-config.xml,faces-config.xml, task flow, or page and choose Debug. -
From the task flow diagrammer, right-click an activity and choose Debug. Only task flows that do not use page fragments can be run.
-
-
When the application is paused at a breakpoint, an Execution Point icon appears next to the breakpoint icon on the action binding item. You can examine the application using several debugger windows.
The application is paused when the binding is executed.
Note:
Be sure that the application has actually hit a breakpoint by checking the Breakpoints window or checking that there is an Execution Point icon (red right arrow) next to the breakpoint. Depending on where you set the breakpoint, an application may appear to be stopped when in fact it is waiting for user input at the page.
-
The ADF Structure window and the ADF Data window appear by default, as well as several debugger windows. You can examine the runtime structure in the ADF Structure window and its corresponding data in the ADF Data window. See Section 36.9.7, "How to Use the ADF Structure Window," and Section 36.9.8, "How to Use the ADF Data Window."
-
Select a node in the ADF Structure window and view pertinent information in the ADF Data window.
-
When the application is paused, you can remove or disable existing breakpoints and set new breakpoints.
36.9.4 How to Set and Use Page Definition Value Binding Breakpoints
If the page definition has one of these values bindings, you can set breakpoints to pause the application:
-
Attribute value binding
-
Tree value binding
-
Table value binding
To set a breakpoint on a value binding in the page definition file:
-
In the Application Navigator, double-click the page definition file that contains the binding in which you want to set a breakpoint.
-
In the overview editor, click the Bindings and Executables tab, select an attribute, tree, or table binding from the Bindings list, and click on the breakpoint margin to the left of the item. A breakpoint icon appears next to the value binding.
-
Optionally, configure a breakpoint's settings to manage the debugger:
-
Choose View > Breakpoints to open the Breakpoints window.
-
Select the binding breakpoint you want to configure and click the Edit icon.
-
In the Edit ADF Page Definition Binding Breakpoint dialog, click the Conditions tab, specify the conditions which apply to the breakpoint. The conditions must be valid for the breakpoint to occur.
-
Click the Actions tab, specify the actions that you want the debugger to take when the breakpoint occurs and click OK.
For example, the usual action for a breakpoint is to halt the program you are debugging, but you may want the debugger to beep and log information to the Log window without halting the program.
-
-
Start the debugging process.
You can:
-
From the main menu, choose Run > Debug.
-
From the Application Navigator, right-click the project,
adfc-config.xml,faces-config.xml, task flow, or page and choose Debug. -
From the task flow diagrammer, right-click an activity and choose Debug. Only task flows that do not use page fragments can be run.
-
-
When the application is paused at a breakpoint, an Execution Point icon appears next to the breakpoint icon on the attribute value binding. You can examine the application using several debugger windows.
The application pauses before an appropriate method of the ADF source code, as described in Table 36-1. New values will be the parameters that go into the method.
Note:
Be sure that the application has actually hit a breakpoint by checking the Breakpoints window or checking that there is an Execution Point icon (red right arrow) next to the breakpoint. Depending on where you set the breakpoint, an application may appear to be stopped when in fact it is waiting for user input at the page.
-
The ADF Structure window and the ADF Data window appear by default, as well as several debugger windows. You can examine the runtime structure in the ADF Structure window and its corresponding data in the ADF Data window. See Section 36.9.7, "How to Use the ADF Structure Window," and Section 36.9.8, "How to Use the ADF Data Window."
-
Select a node in the ADF Structure window and view pertinent information in the ADF Data window.
-
Continue debugging the application as required, using the step functions as described in Table 36-3. The key step function is Step Over (F8).
When the application is paused, you can remove or disable existing breakpoints and set new breakpoints.
36.9.5 How to Set and Use Page Definition Contextual Event Breakpoints
If the page definition defines contextual events, you can set breakpoints on the contextual events to pause the application.
To set a breakpoint on a contextual event in the page definition file:
-
In the Application Navigator, double-click the page definition file that contains the binding in which you want to set a breakpoint.
-
In the overview editor, click the Contextual Events tab, select a contextual event from the Events list, and click on the breakpoint margin to the left of the item. A breakpoint icon appears next to the contextual event.
-
Optionally, configure a breakpoint's settings to manage the debugger:
-
Choose View > Breakpoints to open the Breakpoints window.
-
Select the contextual event breakpoint you want to configure and click the Edit icon.
-
In the Edit ADF Contextual Events Breakpoint dialog, click the Conditions tab, specify the conditions which apply to the breakpoint. The conditions must be valid for the breakpoint to occur.
-
Click the Actions tab, specify the actions that you want the debugger to take when the breakpoint occurs and click OK.
For example, the usual action for a breakpoint is to halt the program you are debugging, but you may want the debugger to beep and log information to the Log window without halting the program.
-
-
Start the debugging process.
You can:
-
From the main menu, choose Run > Debug.
-
From the Application Navigator, right-click the project,
adfc-config.xml,faces-config.xml, task flow, or page and choose Debug. -
From the task flow diagrammer, right-click an activity and choose Debug. Only task flows that do not use page fragments can be run.
-
-
When the application is paused at a breakpoint, an Execution Point icon appears next to the breakpoint icon on the contextual event. You can examine the application using several debugger windows.
The application pauses before the contextual event is raised.
Note:
Be sure that the application has actually hit a breakpoint by checking the Breakpoints window or checking that there is an Execution Point icon (red right arrow) next to the breakpoint. Depending on where you set the breakpoint, an application may appear to be stopped when in fact it is waiting for user input at the page.
-
The ADF Structure window and the ADF Data window appear by default, as well as several debugger windows. You can examine the runtime structure in the ADF Structure window and its corresponding data in the ADF Data window. See Section 36.9.7, "How to Use the ADF Structure Window," and Section 36.9.8, "How to Use the ADF Data Window."
-
Select a node in the ADF Structure window and view pertinent information in the ADF Data window.
-
Continue debugging the application as required, using the step functions as described in Table 36-3. The key step function is Step Over (F8).
When the application is paused, you can remove or disable existing breakpoints and set new breakpoints.
36.9.6 How to Set and Use ADF Lifecycle Phase Breakpoints
You can set both Before and After ADF lifecycle phase breakpoints on any of the ADF lifecycle phases. For each phase, you can set Before only, After only, or both. You can set breakpoints on as many phases as you want.
You can create the breakpoint and customize the options using the Create ADF Lifecycle Phase Breakpoint dialog from the Breakpoints window menu. Or You can create breakpoints with the default options using the ADF Lifecycle Breakpoints window. After a lifecycle breakpoint has been set, you can edit the options using the Edit ADF Lifecycle Phase Breakpoint dialog, which is also launched from the Breakpoints window.
You can set ADF lifecycle breakpoints on any of the ADF lifecycle phases:
-
JSF Restore View
-
Initialize Content
-
Prepare Model
-
JSF Apply Request Values
-
JSF Process Validations
-
JSF Update Model Values
-
Validate Model Updates
-
JSF Invoke Application
-
Metadata Commit
-
Prepare Render
-
JSF Render Response
To set or manage an ADF lifecycle phase breakpoint from the Breakpoints window:
-
Choose View > Breakpoints to open the Breakpoints window.
-
Click the Add icon and choose ADF Lifecycle Phase Breakpoint.
-
In the Create ADF Lifecycle Phase Breakpoint dialog Definition tab:
-
Select the ADF lifecycle phase where you want to set a breakpoint
-
Select Before Phase or After Phase breakpoint
-
-
In the Conditions tab, select the options you want and click OK.
-
In the Actions tab, select the options you want and click OK.
To set an ADF Lifecycle Phase Breakpoint using the breakpoint icon:
-
In the task flow diagrammer or in the ADF Structure window, click the ADF Lifecycle Breakpoints icon, as shown in Figure 36-30.
-
In the ADF Lifecycle Breakpoints window, click on the left margin next to the ADF lifecycle phase to set a Before breakpoint, and on the right margin to set an After breakpoint. A red dot icon appears to indicate the breakpoint is set, as shown in Figure 36-31. The breakpoint will be set with the default breakpoint options. To remove the breakpoint, click the red dot icon.
-
If you want to edit breakpoint options, select the breakpoint in the Breakpoints window and choose the Edit icon.
To debug an application using ADF Lifecycle Phase Breakpoints:
-
Start the debugging process.
You can:
-
From the main menu, choose Run > Debug.
-
From the Application Navigator, right-click the project,
adfc-config.xml,faces-config.xml, task flow, or page and choose Debug. -
From the task flow diagrammer, right-click an activity and choose Debug. Only task flows that do not use page fragments can be run.
-
-
When the application is paused at an ADF lifecycle phase breakpoint, an Execution Point icon appears next to the breakpoint icon and the ADF lifecycle phase is in bold in the ADF Lifecycle Breakpoints window, as shown in Figure 36-32. You can examine the application using several debugger windows.
Note:
Be sure that the application has actually hit a breakpoint by checking the Breakpoints window for an breakpoint encounter or checking that there is an Execution Point icon (red right arrow) next to the breakpoint. Depending on where you set the breakpoint, an application may appear to be stopped when in fact it is waiting for user input at the page.
-
The ADF Structure window and the ADF Data window appear by default, as well as several debugger windows. You can examine the runtime structure in the ADF Structure window and its corresponding data in the ADF Data window. The current ADF lifecycle phase is displayed at the top of the ADF Structure window. For more information, see Section 36.9.7, "How to Use the ADF Structure Window," and Section 36.9.8, "How to Use the ADF Data Window."
-
Select a node in the ADF Structure window and view pertinent information in the ADF Data window.
-
Continue debugging the application as required, using the step functions as described in Table 36-3. The key step function is Step Over (F8).
When the application is paused, you can remove or disable existing breakpoints and set new breakpoints.
36.9.7 How to Use the ADF Structure Window
When the application is paused at a breakpoint, the ADF Structure window displays a tree structure of the ADF runtime objects and their relationships within the application. In particular, it shows the hierarchy of view ports, which represent either the main browser window or contained regions and portlets. When you select different items in the ADF Structure window, the data display in the accompanying ADF Data window changes. For more information about the ADF Data window, see Section 36.9.8, "How to Use the ADF Data Window."
The ADF Structure window and the ADF Data window are shown by default during a debugging session when either of the following is true:
-
The project being debugged contains a
WEB-INF/adfc-config.xmlfile. -
The project being debugged contains any ADF Faces tag libraries.
You can launch the ADF Structure window by choosing View > Debugger > ADF Structure from the main menu. From the ADF Structure window, you can launch the ADF Lifecycle Breakpoints window using the ADF Lifecycle Breakpoints icon.
When a breakpoint is encountered, the ADF Structure window displays the ADF lifecycle phase and a tree structure of the runtime objects, as shown in Figure 36-33.
When you select an item in the ADF Structure window, the data and values associated with that item are displayed in the ADF Data window. Figure 36-34 shows a task flow selected in the ADF Structure window, with its corresponding information displayed in the ADF Data window.
The roots of the hierarchy are the sibling nodes Scopes and ADF Context. The current view port where processing has stopped appears in bold. Default selections within the tree will be retained from the previous breakpoint, so you can monitor any changes between breakpoints. The ADF object where the ADF declarative breakpoint was defined will be opened in the corresponding JDeveloper editor, either the task flow diagrammer or the overview editor for page definition files.
The ADF Structure tree will be rebuilt each time the application breaks and at subsequent steps to reflect the changed state of the objects. Although the entire tree hierarchy will be displayed, only items within the current view port and its parent view port(s) will be available for selection and further inspection. All other items in the tree hierarchy not in the current context will be dimmed and disabled. You can still use the hierarchy to identify runtime object relationships within the application, but it will be limited to the current context (and its parent view ports).
Table 36-4 lists the different types of items that can be displayed in the ADF Structure window hierarchy tree.
Table 36-4 ADF Structure Window Items
| ADF Structure Tree Item | Description |
|---|---|
|
Scopes |
Displayed at the top of the ADF Structure hierarchy above its sibling ADF Context node. There is only one Scopes node in the ADF Structure hierarchy. You can expand the Scopes node to show a list of child scope nodes (such as viewScope and pageFlowScope). If you select a child scope node, the ADF Data window displays the variables and values for that scope. |
|
ADF context |
Displayed as the root node of the ADF Structure hierarchy below its sibling Scopes node. There will only be one ADF Context within the ADF Structure hierarchy. |
|
View port |
View ports are an ADF Controller concept. For this reason, view ports appear within the ADF Structure hierarchy only when the application being debugged utilizes ADF Controller. View ports can represent one of the following:
|
|
ADF task flows |
The page flow stack corresponding to each view port appears as a hierarchy of ADF task flows. The initial ADF task flow called for the stack is a direct child of its corresponding view port. The label of each ADF task flow reflects the corresponding ADF task flow display name (if any) or its task flow ID. Region view ports will not display the item in their page flow stack hierarchy for their implied unbounded task flow. The task flow also provides a tooltip displaying the ADF task flow path, and a context menu item to open to the corresponding ADF task flow within the editor workspace. If ADF Controller is not utilized in the application (or if the page is run outside the context of an ADF task flow), ADF task flows will not appear within the hierarchy. |
|
Page |
Represents the page (view) currently displayed within a browser view port. Presented along with its associated binding container (if any) as a child. If the application being debugged utilizes ADF Controller, pages will be children of each browser view port. The label of each page reflects its corresponding runtime view ID. The page also provides a tooltip displaying the page path, and a context menu item to open to the corresponding page within the editor workspace. If a visual user interface in not implemented for the application, the page will not appear within the hierarchy. |
|
Page fragment |
Represents the page fragment currently displayed within a region view port. Presented along with its associated binding container (if any) as a child. If the application being debugged utilizes ADF Controller, page fragments will be children of each region view port. The label of each page fragment node reflects its corresponding runtime view ID. The page fragment also provides a tooltip displaying the source file page definition path, and a context menu item to open to the corresponding page fragment within the editor workspace. |
|
Binding container |
Represents the binding container for the corresponding page or page fragment. The label of each binding container reflects its corresponding file name (page definition file) without the extension. The binding container node will also provide a tooltip displaying the page fragment path. The binding container also appears under current task flows when used to represent task flow activity bindings (for example, method call activity bindings). If ADF Model is not utilized for the application, binding containers will not appear. |
|
Application data |
Represents the application data objects (for example, ADF Business Components objects or ADF Business Components business service objects) instantiated within the data control frame for the corresponding view port (or binding container if ADF Controller is not used). Application data objects don't need to be currently instantiated for the Application Data node to appear. |
36.9.8 How to Use the ADF Data Window
When an application is paused at an ADF declarative breakpoint, the ADF Data window displays relevant data based on the selection in the ADF Structure window. You can launch the ADF Data window by choosing View > Debugger > ADF Data from the main menu. The content of the ADF Data window based on the selection in the ADF Structure window is summarized in Table 36-5.
Table 36-5 ADF Data Window Content for an ADF Structure Window Selection
| ADF Structure Window | ADF Data Content |
|---|---|
|
Scopes |
Displays memory scope values based on the current context. |
|
ADF context |
Displays the ADF context variables and values hierarchy. ADF context variables and values can be inspected by evaluating the |
|
View port |
Displays view port details, including the |
|
Page flow stack entry |
Displays information for the selected page flow stack entry, including current transaction status and ADF Model save point status. |
|
Page/page fragment |
Displays the page or page fragment UI component tree hierarchy for the selected page or page fragment if the page or page fragment has been rendered. |
|
Binding container |
Displays the binding container runtime values, including parameters, bindings, and executables. |
|
Application data |
Displays application data objects (for example, ADF Business Components objects) instantiated within the current binding context. If the business service layer is implemented with a technology other than ADF Business Components objects (for example, EJB) the application data objects will be displayed in a more generic form. |
The Scopes node in the ADF Structure window can be expanded to show a list of child scope nodes. When a child scope node is selected in the ADF Structure window, the ADF Data window displays the current context values for the selected memory scope, as shown in Figure 36-35.
If the Scopes node itself is selected, then the full list of memory scopes appears also in the ADF Data windows, which can also be expanded for inspection. Figure 36-36 shows the Scopes node selected in the ADF Structure window, and the viewScope child node being selected with its values displayed in the ADF Data window. You can inspect the values of requestScope, viewScope, pageFlowScope, applicationScope, and sessionScope by expanding each corresponding node. pageFlowScope will also appear within the ADF Task Flow content to reflect the values of the specific ADF task flow currently selected in the ADF Structure window. viewScope will also appear within the view port content to reflect the values of the specific view port currently selected in the ADF Structure window.
When the ADF context is selected in the ADF Structure window, as shown in Figure 36-37, the current value of the ADF context variables will be displayed in the ADF Data window. You can also inspect ADF context variables and values by evaluating the #(data.adfContext) EL expression in the EL Evaluator. For more information, see Section 36.8.4, "How to Use the EL Expression Evaluator."
Selecting a view port within the ADF Structure hierarchy will display the view port's current view port details in the ADF Data window, as shown in Figure 36-38. Values displayed for each view port are summarized in Table 36-6.
Table 36-6 ADF Data Window Content for View Port
| View Port | Description |
|---|---|
|
View port ID |
It is displayed |
|
Client ID |
It is displayed |
|
Initial task flow ID |
Initial ADF task flow on the view ports page flow stack. Not displayed for unbounded task flows. Appears as a link to open the corresponding task flow definition in the editor workspace. |
|
Current task flow ID |
Displayed for bounded task flows and not displayed for unbounded task flows. Current ADF task flow on the view port's page flow stack. Appears as a link to open the corresponding task flow definition in the editor workspace. |
|
View activity ID |
Current ADF task flow view activity ID. Applicable only if the current ADF task flow activity is a view activity. |
|
Submitted activity ID |
ADF task flow activity submitting the current request. |
|
Final activity ID |
ADF task flow activity receiving the current request. |
|
Bookmark redirect outstanding |
(Boolean) |
|
Exception |
(If any) |
|
View memory scope |
View memory scope variables and values for the selected view port. |
In the ADF Structure window, each individual ADF task flow within a page flow stack hierarchy is selectable. An ADF task flow selected in the ADF Structure window will display the current task flow information in the ADF Data window, as shown in Figure 36-39. Task flow templates utilized by the selected ADF task flow will be determined by manually navigating to the ADF task flow source file. This is the same way similar functionalities are handled for Java source files. Current information for a selected ADF task flow is summarized in Table 36-7.
Table 36-7 ADF Data Window Content for Task Flow
| Task Flow | Description |
|---|---|
|
ADF task flow reference |
ADF task flow reference |
|
Task flow call activity ID |
Task flow activity ID for the calling task flow. Will be |
|
Calling view activity ID |
The calling view activity of the current view activity displayed by the ADF task flow, if any. |
|
View reached |
(Boolean) |
|
Train model |
Only applicable if the ADF task flow is created as a train. |
|
Transaction started |
(Boolean) Identifies the current status of the ADF task flow transactional state. For example, did the ADF task flow begin a new transaction? |
|
Transaction shared |
(Boolean) Identifies the current status of the ADF task flow transactional state. For example, did the ADF task flow join an existing transaction? |
|
Save point |
Identifies the current status of the ADF task flow's ADF Model save point creation state. For example, was a model save point created upon ADF task flow entry?. |
|
Remote task flow called |
(Boolean) |
|
Remote task flow return URL |
Applies only when calling an ADF task flow remotely. Identifies the URL for return once the task flow called remotely completes. |
|
Data control frame created |
(Boolean) |
|
Data control frame |
Name of data control frame associated with the ADF task flow. |
|
Page flow memory scopes |
Appears as an expandable node to allow inspection of the values of the page flow memory scopes for the task flow selected in the ADF Structure window. The page flow memory scopes will also be displayed within the ADF Structure window's Scopes node. However, the page flow memory scope for the Scopes node will always be based on the application's current context, not the selected task flow. |
When you select a page or page fragment node in the ADF Structure hierarchy, the corresponding UI component tree is displayed within the ADF Data window, as shown in Figure 36-40. If a page or page fragment is based on a page template, you can include the content coming from the page template outside any facet reference elements by selecting the Include Page Template Content checkbox at the top of the ADF Data window. If the page template content is not included, the page or page fragment UI component tree will appear structurally similar to its source file.
When you select a binding container in the ADF Structure hierarchy, it displays within the ADF Data window the node selection listed in Table 36-8.
Table 36-8 ADF Data Window Content for Binding Container
| Binding Container | Description |
|---|---|
|
Page definition link |
Navigates to the corresponding page definition source file and opens it within the editor workspace. |
|
Data Controls |
Displays the binding container's data controls. Data controls implemented by ADF Business Components objects and non-ADF Business Components objects will be presented slightly different. ADF Business Components-based data controls will appear similar to the actual business service implementation using row collections. Non-ADF Business Components-based data controls will typically appear as raw member variables similar to what is displayed in the ADF Declarative Debugger Data window. The ADF Data window shows only cached information such as member variables and arrays. Standard debugger functionality can also be used to customize each element. Each ADF Business Components data control will display the following information:
|
|
Parameters |
Current values of all binding container parameters. |
|
Executables |
Displays executables showing current row indicators, and current and original values (if changed within the same request). This includes the following types of executables:
|
|
Bindings |
Displays value, table, tree, and method bindings. Each binding will display the following information:
|
|
Binding container of page template |
If the corresponding page or page fragment utilized a page template, the binding container of the page template will appear as a child of page or page fragment binding container content. |
When you select a binding container for an application based on non-ADF Business Components objects, the ADF Data window displays the binding container content, as shown in Figure 36-1.
When you select a binding container for an application based on ADF Business Components objects, the ADF Data window displays standard row collection icons, as shown in Figure 36-2.
Expanding the Parameters node in the ADF Data window displays information similar to that shown in Figure 36-43.
Expanding the Executables node in the ADF Data window displays information similar to that shown in Figure 36-44.
If a value has changed, the changed item will be marked with a blue dot to its left and the previous value is displayed in parenthesis. For instance, suppose the OrderTotal value has changed from 7895.81 to 7670.11. The ADF Data window places a blue dot next to OrderTotal and its parent OrdersView1Iterator and displays the current and previous values in the Value column, as shown in Figure 36-45.
Method binding information is displayed in the ADF Data window similar to what is shown in Figure 36-46.
When you select an Application Data node from the ADF Structure window, the ADF Data window displays the application objects, such as ADF Business Components objects, instantiated within the current data control frame for the corresponding view port (or binding context if ADF Controller is not used).
Business services implemented by ADF Business Components objects display the application data content, as shown in Figure 36-47 and described in Table 36-9.
Table 36-9 ADF Data Window Content for Application Data
| Binding Container | Description |
|---|---|
|
Application module |
The application module(s) of the corresponding view port data control frame will appear within the application data hierarchy as the root node(s). An application module design time icon will be used to identify the node(s). The application module node(s) will provide the following information:
|
|
View object |
View objects instantiated within the corresponding view port data control frame will appear underneath the corresponding application module root node as subordinate nodes. Design time icons will be used to identify them. Child view objects will appear subordinate to their parent view objects within the hierarchy. Named row sets will appear similar to view objects. Named iterators for a view object will appear similar to child view objects. Each view object node will provide the following information:
|
|
Entity object |
Entity objects instantiated within the corresponding view port data control frame will appear underneath the application module root node as subordinate nodes. Design time icons will be used to identify them. Each entity object node will provide the following information:
|
Business services implemented by non-ADF Business Components objects display application data content using raw member variables. The format is similar to the display of non-ADF Business Components content for the binding container, as shown in Figure 36-41.
36.9.9 What Happens When You Set an ADF Declarative Breakpoint
When you set an ADF declarative breakpoint, JDeveloper adds the breakpoint to the appropriate class, method, or other construct in the ADF source Java code that corresponds to the breakpoint. Once the breakpoint is set in the code, the standard Java debugger mechanism pauses application execution when the breakpoint is reached. When the breakpoint is reached, it will be identified by a red dot icon in the Breakpoints window. Depending on the type of declarative breakpoint that was reached, it will also appear as a red dot icon in the task flow activity, in the page definition breakpoint margins, or in the ADF Lifecycle Breakpoints window.
For task flow activity breakpoints, the debugger pauses the application within the JSF Invoke Application phase before the activity where the breakpoint is set. In other words, the activity where the breakpoint is set is not executed.
For task flow view activities, however, the application is paused within the JSF Render Response phase after the view activity is executed, but before the new page is rendered.
For a page definition Before executable breakpoint, the debugger pauses the application when the executable is refreshed. For a page definition Before action binding breakpoint, the debugger pauses the application when the binding is executed. For a page definition Before attribute value binding breakpoint, the debugger pauses the application before the attribute's setInputValue() method in the ADF source code is executed.
For a Before lifecycle breakpoint, the debugger pauses the application before it enters the next lifecycle phase. For an After lifecycle breakpoint, the debugger pauses the application after the lifecycle phase and before the next phase.
36.10 Setting Java Code Breakpoints
You can use the ADF Declarative Debugger to set breakpoints on Java classes and methods, as in any standard Java code debugger. You can use Java code breakpoints in combination with ADF declarative breakpoints or by themselves. For most ADF applications, ADF declarative breakpoints will provide enough debugging information to troubleshoot the application. For information about using ADF declarative breakpoints, see Section 36.9, "Setting ADF Declarative Breakpoints." However, you may need to set breakpoints on specific classes or methods for further inspection. Or, you may be debugging a non-ADF application, in which case, you can use Java code breakpoints.
JDeveloper provides a class locator feature that assists you in finding the class you want to break on. If you can obtain Oracle ADF source code, you can enhance your debugging by having access to various ADF classes and methods. For more information about getting ADF source code, see Section 36.8.1, "Using ADF Source Code with the Debugger." If you obtained the ADF source, you can further enhance the debugging experience by using the debug library version of the ADF source, as described in Section 36.10.4, "How to Use Debug Libraries for Symbolic Debugging."
36.10.1 How to Set Java Breakpoints on Classes and Methods
You can set Java breakpoints on your classes and methods. If you have ADF source code, you can set Java breakpoints in the source as well. If you are debugging an ADF application, you should check to see whether ADF declarative breakpoints can be used instead of Java code breakpoints. For more information, see Section 36.9, "Setting ADF Declarative Breakpoints."
Before you attempt to use breakpoints, you should try to run the application and look for missing or incomplete data, actions and methods that are ignored or incorrectly executed, or other unexpected results. If you did not find the problem, create a debugging configuration that will enable the ADF Log and send Oracle ADF messages to the Log window. For more information, see Section 36.6.3, "How to Create an Oracle ADF Debugging Configuration."
To set Java breakpoints to debug an application:
-
From the main menu, choose Navigate > Go to Java Type (or press Ctrl+Minus) and use the dialog to locate the Oracle ADF class that represents the entry point for the processing failure.
Note:
JDeveloper will locate the class from the user interface project with current focus in the Application Navigator. If your workspace contains more than one user interface project, be sure that the one with the current focus is the one you want to debug.
-
Open the class file in the source editor and find the Oracle ADF method call that will enable you to step into the statements of the method.
-
Set a breakpoint on the desired method and run the debugger.
-
When the application stops on the breakpoint, use the Data window to examine the local variables and arguments of the current context.
Tip:
If you are using the Go to source context menu command in the Data, Watches, or Smart Data window, you can go back to the execution point by using the back button. You can also access the back button through the Navigate menu.
Once you have set breakpoints to pause the application at key points, you can proceed to view data in the Data window. To effectively debug your web page's interaction with the ADF Model layer, you need to understand:
-
The ADF page lifecycle and the method calls that get invoked
-
The local variables and arguments that the ADF Model layer should contain during the course of application processing
Awareness of Oracle ADF processing will give you the means to selectively set breakpoints, examine the data loaded by the application, and isolate the contributing factors.
Note:
JSF web pages may also use backing beans to manage the interaction between the page's components and the data. Debug backing beans by setting breakpoints for them as you would with any other Java class file.
36.10.2 How to Optimize Use of the Source Editor
Once you have added the ADF source library to your project, you have access to the helpful Quick Javadoc feature (Ctrl+D) that the source editor makes available. Figure 36-48 shows Quick Javadoc for a method like findSessionCookie().
36.10.3 How to Set Breakpoints and Debug Using ADF Source Code
After loading the ADF source code, you can debug any Oracle ADF code for the current project the same way that you do your own Java code. This means that you can press Ctrl+Minus to type in any class name in Oracle ADF, and JDeveloper will open its source file automatically so that you can set breakpoints as desired.
36.10.4 How to Use Debug Libraries for Symbolic Debugging
When debugging Oracle ADF source code, by default you will not see symbol information for parameters or member variables of the currently executing method.
For example, in a debugging session without ADF source code debug libraries, you may see unrecognizable names such as "_slot", as shown in Figure 36-49.
These names are hard to decipher and make debugging more difficult. You can make debugging easier by using the debug versions of the ADF JAR files supplied along with the source while debugging in your development environment.
Note:
The supplied debug libraries should not be used in a test or production environment, since they typically have slightly slower runtime performance than the optimized JAR files shipped with JDeveloper.
The debug library JARs are versions of Oracle ADF JARs that have been compiled with additional debug information. When you use these debug JAR files instead of the default optimized JARs, you will see all of the information in the debugger. For example, the variable evid is now identified by its name in the debugger, as shown in Figure 36-50.
Before you replace the standard library JAR, make sure that JDeveloper is not running. If it's currently running, exit from the product before proceeding.
To replace the standard library JARs with the debug library JARs:
-
With JDeveloper closed, make a
backupsubdirectory of all existing optimized JAR files in the./BC4J/libdirectory of your JDeveloper installation. For example, assumingjdev11is the JDeveloper home directory:C:\jdev11\BC4J\lib> mkdir backup C:\jdev11\BC4J\lib> copy *.jar backup
-
For each ADF library that you want debug symbols for while debugging, copy the
_g.jarversion of the matching library over the existing, corresponding library in theC:\jdev11\BC4J\libdirectory.This is safe to do since you made a backup of the optimized JAR files in the
backupdirectory in Step 2.Since debug libraries typically run a little slower than libraries compiled without debug information, this diagnostic message is to remind you not to use debug libraries for performance timing:
**************************************************************************
*** WARNING: Oracle BC4J debug build executing - do not use for timing ***
**************************************************************************
-
To change back to the optimized libraries, simply copy the JAR file(s) in question from the
./BC4J/lib/backupdirectory back to the./BC4J/libdirectory.
36.10.5 How to Use Different Kinds of Java Code Breakpoints
You first need to understand the different kinds of Java code breakpoints and where to create them.
To see the debugger Breakpoints window, choose View > Breakpoints from the main menu or press Ctrl+Shift+R.
You can create a new Java code breakpoint by choosing Create Breakpoint from the context menu in the Breakpoints window. The Breakpoint Type dropdown list controls what kind of breakpoint you will create, as shown in Table 36-10.
Note:
You can also use the Create Breakpoint dialog to create an ADF lifecycle phase declarative breakpoint. For information about creating ADF declarative breakpoints, see Section 36.9.6, "How to Set and Use ADF Lifecycle Phase Breakpoints."
Table 36-10 Different Types of Java Breakpoints
| Breakpoint Type | The Breakpoint Occurs Whenever | Usage |
|---|---|---|
|
Exception |
An exception of this class (or a subclass) is thrown. |
An Exception breakpoint is useful when you don't know where the exception occurs, but you know what kind of exception it is (for example, |
|
Source |
A particular source line in a particular class in a particular package is run. |
You rarely create a source breakpoint in the Create Breakpoint dialog, because it's much easier to create it by first using the Navigate > Go to Java Type menu (accelerator Ctrl+Minus), then scrolling to the line number you want — or using Navigate > Go to Line (accelerator Ctrl+G) — and finally clicking in the breakpoint margin at the left of the line you want to break on. This is equivalent to creating a new source breakpoint, but it means you don't have to type in the package, class, and line number by hand. |
|
Method |
A method in a given class is invoked. |
The Method breakpoint is useful for setting breakpoints on a particular method you might have seen in the call stack while debugging a problem. If you have the source, you can set a source breakpoint wherever you want in that class, but this kind of breakpoint lets you stop in the debugger even when you don't have source for a class. |
|
Class |
Any method in a given class is invoked. |
The Class breakpoint can be used when you might know the class involved in the problem, but not the exact method you want to stop on. This kind of breakpoint does not require source. The Browse button helps you quickly find the fully qualified class name you want to break on. |
|
Watchpoint |
A given field is accessed or modified. |
The Watchpoint breakpoint can be used to find a problem if the code inside a class modifies a member field directly from several different places (instead of going through setter or getter methods each time). You can pause the debugger when any field is modified. You can create a breakpoint of this type by using the Toggle Watchpoint menu item on the context menu when pointing at a member field in your class's source. |
36.10.6 How to Edit Breakpoints for Improved Control
After creating a Java code breakpoint you can edit the breakpoint in the Breakpoints window by right-clicking it and choosing Edit in the context menu.
Note:
You can use the Edit Breakpoint dialog to edit an ADF declarative breakpoint. However, you cannot edit some of the other information such as the information in the Definition tab. You can launch the Edit Breakpoint dialog by choosing Edit from the context menu in the Breakpoints window. For information about creating ADF declarative breakpoints, see Section 36.9, "Setting ADF Declarative Breakpoints."
Some of the features you can use by editing your breakpoint are:
-
Associate a logical "breakpoint group" name to group this breakpoint with others of the same group name. Breakpoint groups make it easy to enable/disable an entire set of breakpoints in one operation.
-
Associate a debugger action to a breakpoint when the breakpoint is hit. The default action is to stop the debugger so that you can inspect the application states, but you can add a sound alert, write information to a log file, and enable or disable group of breakpoints.
-
Associate a conditional expression with the breakpoint so that the debugger stops only when that condition is met. The expressions can be virtually any boolean expression, including:
-
expr==value -
expr.equals("value") -
exprinstanceof.fully.qualified.ClassName
Note:
Use the debugger Watches window to evaluate the expression first to make sure it's valid.
-
36.10.7 How to Filter Your View of Class Members
You can use the debugger to filter the members that are displayed in the debugger window for any class. In the debugger's Data window, selecting any item and choosing Preferences from the context menu brings up a dialog that lets you customize which members appear in the debugger and (more importantly sometimes) which members don't appear. You can filter by class type to simplify the amount of scrolling you need to do in the debugger Data window. This is especially useful when you might be interested only in a handful of a class's members.
36.10.8 How to Use Common Oracle ADF Breakpoints
If you loaded Oracle ADF source code, you can use the breakpoints listed in Table 36-11 to debug your application.
By looking at the Stack window when you hit these breakpoints, and stepping through the source, you can get a better idea of what's going on.
Table 36-11 Commonly Used ADF Breakpoints
| Breakpoint | Breakpoint Type | Usage |
|---|---|---|
|
|
Exception |
This breakpoint useful for setting a breakpoint on the base class of all ADF Business Components runtime exceptions. |
|
|
Exception |
This is the base class for exceptions originating from the database, like a failed DML operation due to an exception raised by a trigger or by a constraint violation. |
|
|
Method |
You can also perform the same debugging function by setting an ADF declarative breakpoint on the page definition action binding. See Section 36.9.3, "How to Set and Use Page Definition Action Binding Breakpoints." If you prefer to use this Java breakpoint, you can find it in the This is the method that will execute when any ADF action binding is invoked, and you can step into the logic and look at parameters if relevant. |
|
|
Method |
This is the method that will be called when a view object executes its SQL query. |
|
|
Method |
This is the method that will be called when any view row attribute is set. |
|
|
Method |
You can also perform the same debugging function by setting an ADF declarative breakpoint on the page definition attribute value binding. See Section 36.9.4, "How to Set and Use Page Definition Value Binding Breakpoints." This is the method that will be called when any entity object attribute is set. |
36.11 Regression Testing with JUnit
Testing your business services is an important part of your application development process. By creating a set of JUnit regression tests that exercise the functionality provided by your application module, you can ensure that new features, bug fixes, or refactorings do not destabilize your application. JDeveloper's integrated support for creating JUnit regression tests makes it easy test your application. Its integrated support for running JUnit tests means that any developer on the team can run the test suite with a single mouse click, greatly increasing the chances that every team member can run the tests to verify their own changes to the system. Furthermore, by using JDeveloper's integrated support for creating and running Apache Ant build scripts, you can easily incorporate running the tests into your automated build process as well. You can create a JUnit test for your application module, run it, and integrate the tests into an Ant build script.
JDeveloper provides the ability to generate JUnit test cases, test fixtures, and test suites. You can create test cases to test individual Java files containing single or multiple Java classes. You can create JUnit test fixtures that can be reused by JUnit test cases. You can group all these test cases into a JUnit test suite, which you can run together as a unit.
You can also use the JUnit BC4J Test Suite wizard to generate a test suite when there is an application module in the project. The wizard generates a test suite, test fixture, and a test case for each view object in the application module.
You can create a separate project to contain your regression tests or to integrate the test files into an existing project. If you are creating an ADF Business Components test, you should create a separate project for testing.
Creating separate projects for testing has the following advantages:
-
The ability to compile the base project without having a dependency on JUnit
-
The ability to package the base project for deployment without having to exclude the test classes.
If you are creating separate projects for JUnit testing, you should create directory structures that mirror the structure of the packages being tested. You may want to name the test classes using a naming convention that can easily identify the package being tested. For example, if you are testing myClass.java, you can name the test class myClassTest.java.
Although having separate projects has many advantages, in certain cases it may be easier to include the tests within the project. For example, the Fusion Order Demo application has a JUnit regression test suite in the FODCustomization workspace Customization Extension project.
You can use the Create Test wizards in the context of the project to create a JUnit test case, test fixture, or test suite. However, if you do not want to include these tests as part of the deployment, you may want to separate the tests out in their own project.
Tip:
If you don't see the Create Test wizards, use JDeveloper's Help > Check for Updates feature to install the JUnit Integration extension before continuing.
Each test case class contains a setUp() and tearDown() method that JUnit invokes to allow initializing resources required by the test case and to later clean them up. These test case methods invoke the corresponding setUp() and tearDown() methods to prepare and clean up the test fixture for each test case execution. Any time a test in the test case needs access to the application module, it uses the test fixture's getApplicationModule() method. The method returns the same application module instance, saved in a member field of the test fixture class, between the initial call to setUp() and the final call to tearDown() at the end of the test case.
JDeveloper supports JUnit 4, which allows annotations to be used instead of explicitly having to name the methods setUp() and tearDown().These annotations — @Before, @After — allow you to have multiple setup and teardown methods, including inherited ones if required.
The generated ExampleModuleConnectFixture is a JUnit test fixture that encapsulates the details of acquiring and releasing an application. It contains a setUp() method that uses the createRootApplicationModule() method of the Configuration class to create an instance of an application module. Its tearDown() method calls the matching releaseRootApplicationModule() method to release the application module instance.
Your own testing methods can use any of the programmatic APIs available in the oracle.jbo package to work with the application module and view object instances in its data model. You can also cast the ApplicationModule interface to a custom interface to have your tests invoke your custom service methods as part of their job. During each test, you will call one or more assertXxx() methods provided by the JUnit framework to assert what the expected outcome of a particular expression should be. When you run the test suite, if any of the tests in any of the test cases contains assertions that fail, the JUnit Test Runner window displays the failing tests with a red failure icon.
The JUnit test generation wizard generates skeleton test case classes for each view object instance in the data model, each of which contains a single test method named testAccess(). This method contains a call to the assertNotNull() method to test that the view object instance exists.
// In ViewInstanceNameTest.java test case class
  public void testSomeMeaningfulName() {
  // test assertions here
  }
Each generated test case can contain one or more test methods that the JUnit framework will execute as part of executing that test case. You can add a test to the test case simply by creating a public void method in the class whose name begins with the prefix test or use the annotation @Test.
36.11.1 How to Obtain the JUnit Extension
JUnit must be loaded as an extension to JDeveloper before it becomes available and appears in the menu system.
-
From the main menu, choose Help > Check for Updates.
-
In the Source page of the Check for Updates dialog, select Search Update Centers and Official Oracle Extensions and Updates and click Next.
If you have the JUnit zip file or if the JUnit selection does not appear in the Available Updates list, select Install From Local File to load the JUnit zip file.
-
In the Updates page, select JUnit Integration and click Next, as shown in Figure 36-51.
-
On the License Agreements page, click I Accept and click Finish.
36.11.2 How to Create a JUnit Test Case
Before you create a JUnit test case, you must have created a project that is to be tested.
To generate a JUnit test case:
-
In the Application Navigator, select the project you want to generate a test case for, right-click and choose New.
-
In the New Gallery, expand General, select Unit Tests(JUnit) and then Test Case, and click OK.
-
In the Select the Class to Test page of the Create Test Case dialog, enter the class under test or click Browse.
-
In the Class Browser dialog, locate the class you want to test or enter the beginning letters in the Match Class Name field. The Match Class list will be filtered for easier identification.
For example, entering
FODfilters the list down to three items, as shown in Figure 36-52.Select the class and click OK to close the dialog. Click Next.
-
Select the individual methods you want to test, and click Next.
For example, in Figure 36-53, the four methods that are checked are to be tested.
-
In the Setup Test Case Class page, enter the name of the test case, the package, and the class it extends and select the list of built-in functions JUnit will create stubs for. Click Next.
For example, in Figure 36-54, JUnit will create a stub for the
setUp()method for theFodCompanyCustomizationLayerTesttest case in theoracle.fodemo.customizationpackage. -
In the Select Test Fixtures page, select any test fixtures you want to add to the test case or click Browse.
-
Make sure that all the test fixtures you want to add to the test case are selected in the list and click Finish.
36.11.3 How to Create a JUnit Test Fixture
You should create a JUnit test fixture if you require more than one test for a class or method. A JUnit text fixture allows you to avoid duplicating test code that is needed to initialize testing.
To generate a JUnit test fixture:
-
In the Application Navigator, select the project you want to generate a test fixture for, right-click and choose New.
-
In the New Gallery, expand General, select Unit Tests(JUnit) and then Test Fixture, and click OK.
-
In the Create Test Fixture dialog, enter the name of the test fixture, the package, and any class it extends.
-
Click OK.
36.11.4 How to Create a JUnit Test Suite
Before you create a JUnit test suite, you should have already created JUnit test cases that can be added to the test suite.
To generate a JUnit test suite:
-
In the Application Navigator, select the project you want to generate a test fixture for, right-click and select New.
-
In the New Gallery, expand General, select General and then Test Suite, and click OK.
-
In the Setup Test Suite Class page of the Create Test Suite dialog, enter the name of the test suite, the package, and the class it extends. Click Next.
For example, in Figure 36-55, an
AllTeststest suite is created that extends thejava.lang.Objectclass. -
In the Select Test Cases page of the Create Test Suite dialog, check that all the test cases you want included in the test suite have been selected. The test cases you have created will populate the list. Deselect any test cases that you do not want included. Click Finish.
For example, in Figure 36-56, both test cases are selected to be in the test suite.
36.11.5 How to Create a Business Components Test Suite
The test fixture that is created is a singleton class to reduce the number of connections. If you want to connect or disconnect for each test case, customize the test case using the JUnit 4 annotations @Before and @After.
The JUnit BC4J Test Suite wizard will generate tests for each view object in the application module. If the application module does not have exported methods, the wizard will also generate a test for the application module itself. A generated view object class has the format view_objectVOTest.java and is placed into a package with the format package.view.viewobjectVO, where package is the application module package. A generated application module test has the format application_moduleAMTest.java and is placed into a package with the format package.applicationModule. A generated test fixture class has the format applicationmoduleAMFixture.java and is placed in the same package as the application module test.
The generated all test suite class has the format AllapplicationmoduleTest.java and is placed into the package with the same name as the application module package name.
A test case XML file is also generated for each application module or view object test. The XML file contains test methods defined in the application module or view object test cases. It does not include the test methods from the base classes (if any) because there may be too many duplicates.
For instance, after you created a test suite for an application module named StoreAAppModule with view objects Employees1View1 and Employees1View2 in the package StoreAPack, the Application Navigator displays the test hierarchy as shown in Figure 36-19.
Create application modules in the project.
To create a business components test suite:
-
In the Application Navigator, click New.
You will create a separate project for the business components tests.
-
In the New Gallery, expand General, select Projects and then Java Projects, and click OK.
-
In the Project Name page of the Create Java Project wizard, enter a name and the directory path for the test project, and click Next.
-
In the Project Java Settings page, enter the package name, the directory of the Java source code in your project, and output directory where output class files will be placed, and click Finish.
-
In the Application Navigator, double-click the application module you want to test.
-
In the overview editor, click the Java navigation tab.
-
In the Java page, click the Edit icon for the Java Class section.
-
In the Select Java Options dialog, select Generate Application Module Class and click OK.
-
In the overview editor Java tab, click the Edit icon in the Class Interface section.
-
In the Edit Client Interface dialog, shuttle the methods you want to test to the Selected pane, and click OK.
-
In the Application Navigator, right-click the test project you have created and choose New.
-
In the New Gallery, expand General, select Unit Tests and then Business Components Test Suite, and click OK.
-
In the Configure Tests page of the JUnit BC4J Test Suite wizard, select values for the following and click Next:
-
Business Component Project: Select the project that has the application module you want to test.
-
Application Module: Select the application module you want to test.
-
Configuration: Choose a local or shared application module.
-
Test Base Class-Application Module Extends: You can specify different base cases. The generated test case classes will extend from that base class where all public abstract methods in the base class will have simple and default implementation method bodies.
-
Test Base Class-View Object Extends: You can specify which class the view object extends. The generated test case classes will extend from that base class where all public abstract methods in the base class will have simple and default implementation method bodies.
-
-
In the Summary page, verify the selections and click Finish.
36.11.6 How to a Create Business Components Test Fixture
When you create a business components test suite, a business components test fixture is created with it. You can also create Business Components test fixtures independently.
A generated test fixture class has the format applicationmoduleAMFixture.java and put into a package with the format package.applicationModule, where package is the application module package.
Create application modules in the project.
To create a business components test fixture:
-
In the Application Navigator, click New.
You will create a separate project for the business components tests.
-
In the New Gallery, expand General, select Projects and then Java Projects, and click OK.
-
In the Project Name page of the Create Java Project dialog, enter a name and the directory path for the test project, and click Next.
-
In the Project Java Settings page, enter the package name and the source and output directories, and click Finish.
-
In the Application Navigator, double-click the application module you want to test.
-
In the overview editor, click the Java navigation tab and click the Edit icon of the Java Class section.
-
In the Select Java Options dialog, select Generate Application Module Class, and click OK.
-
In the overview editor, click the Edit icon of the Class Interface section.
-
In the Edit Client Interface dialog, shuttle the methods you want to test to the Selected pane, and click OK.
-
In the Application Navigator, right-click the test project you have created and choose New.
-
In the New Gallery, expand General, select Unit Tests and then Business Components Test Fixture, and click OK.
-
In the Configure Tests page of the JUnit BC4J Test Fixture wizard, select values for the following and click Next:
-
Business Component Project: Select the project that has the application module you want to test.
-
Application Module: Select the application module you want to test.
-
Configuration: Choose a local or shared application module.
-
-
In the Summary page, verify the test fixture class and click Finish.
36.11.7 How to Run a JUnit Test Suite as Part of an Ant Build Script
Apache Ant is a popular, cross-platform build utility for which JDeveloper offers design time support. You can incorporate the automatic execution of JUnit tests and test output report generation by using Ant's built-in junit and junitreport tasks. Example 36-3 shows a task called tests from the FODCustomizations Ant build.xml file in the CustomizationExtension project. It depends on the build and buildTests targets that Ant ensures have been executed before running the tests target.
Example 36-3 Ant Build Target Runs JUnit Test Suite
  <target name="testCustomizations" depends="compileExtensionClasses">
    <junit printsummary="yes" haltonfailure="yes">
      <classpath refid="customization.classpath">
        <pathelement location="${customization.build.dir}"/>
      </classpath>
      <formatter type="plain"/>
      <test name="oracle.fodemo.customization.tests.AllTests"/>
    </junit>
  </target>
The junit tag contains a nested test tag that identifies the test suite class to execute and specifies a directory in which to report the results. The junitreport tag allows you to format the test results into a collection of HTML pages that resemble the format of Javadoc.
To try running the JUnit test from Ant, select the build.xml file in the Application Navigator, and choose Run Ant Target > tests from the context menu.
