Here is an example of a basic bar chart.
The chart compares the suggested and actual prices for each varietal.
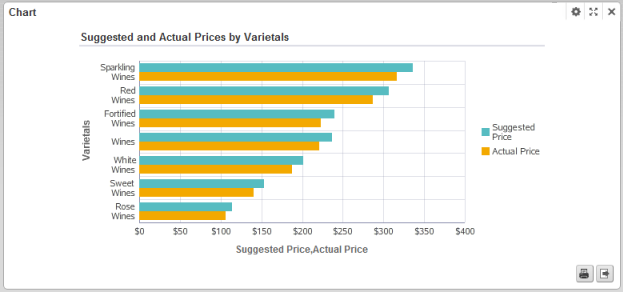
The configuration for this chart is:
| Chart Setting | Value |
|---|---|
| Chart type (Subtype) | Bar (Basic Horizontal) |
| Series metric (aggregation) | Suggested Price (avg)
Actual Price (avg) |
| Group dimension | Varietals |
| Series dimension | No series dimension |
| Sorting | First metric high to low |
