3 Exploring the User Interface
Oracle Enterprise Manager Ops Center is an enterprise-level datacenter software that manages all the aspects of data center. Oracle Enterprise Manager Ops Center displays its information in a browser interface. The format of the information is in text, tables, graphs, and charts, and is organized into hierarchies and tabs. You can view the information and perform the actions according to the role you have been assigned.
This chapter includes the following sections:
3.1 Overview of the User Interface
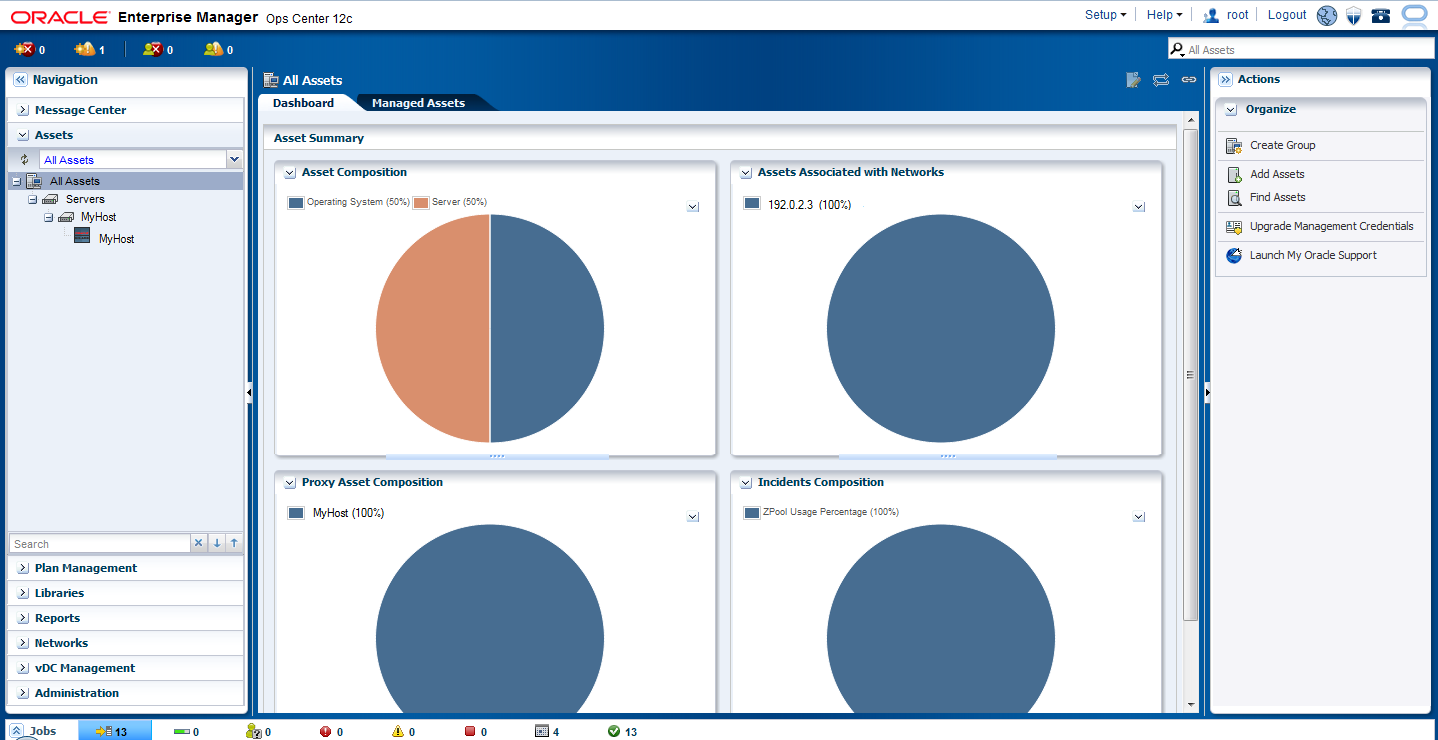
The user interface has a rich set of features that enable you to observe and control your datacenter's assets. These features present a range of information from a high-level overview of your datacenter to the low-level details of a specific asset. You can view the information in the center pane according to your selections made in the Navigation pane and in the Actions pane.
Figure 3-1 shows the user interface of Oracle Enterprise Manager Ops Center.
Figure 3-1 User Interface of Oracle Enterprise Manager Ops Center
Description of "Figure 3-1 User Interface of Oracle Enterprise Manager Ops Center"
Oracle Enterprise Manager Ops Center comprises of five panes:
-
The Masthead: This pane displays the global functions and information about the Oracle Enterprise Manager Ops Center instance.
-
The Navigation pane: This pane displays several sections like Message Center, Assets, Plan Management, Libraries, Reports, Networks, vDC Management, and Administration.
-
The Actions pane: This pane displays the actions that operate on the object currently selected in the Navigation pane. The actions of the Actions pane are enabled or disabled based on the state of the object or your role.
Only actions that are directly applied to the object are displayed in Actions pane.
-
The Jobs pane: This pane displays the number of jobs in Oracle Enterprise Manager Ops Center, categorized by the status of respective jobs.
-
The Center pane: This pane displays detailed information of the object that is currently selected in the Navigation pane.
For incidents, hover your mouse over the incident icons in the upper left corner of the user interface to display more information about the incidents.
3.2 Status of Your Session
Oracle Enterprise Manager Ops Center displays the following icons in the title bar. To view information about the status of your session, click the icons displayed in the title bar.
Figure 3-2 shows the icons of the title bar in the user interface of Oracle Enterprise Manager Ops Center.
-
Setup: Sets roles and preferences for the user.
-
Help: Opens help for Oracle Enterprise Manager Ops Center to provide an aid that is necessary to accomplish a task or satisfy a need.
-
Your Account: Describes your account details and information.
-
Logout: Logs you out of the application.
-
Status of Internet Connection: Indicates whether Oracle Enterprise Manager Ops Center is connected to Internet access.
-
Status of Knowledge Base Service: Indicates whether Oracle Enterprise Manager Ops Center is connected to Knowledge Base Service to obtain the latest operating system updates from My Oracle Support.
-
Status of My Oracle Support Services: Indicates whether Oracle Enterprise Manager Ops Center is connected to My Oracle Support. You must enter a valid My Oracle Support (MOS) credential to be connected.
For more information about My Oracle Support credential, see My Oracle Support Account at the following website:
3.3 Message Center
Oracle Enterprise Manager Ops Center displays incidents, generates notifications, displays service requests that are generated with the ASR feature in Oracle Enterprise Manager Ops Center, and the warranty information of an asset.
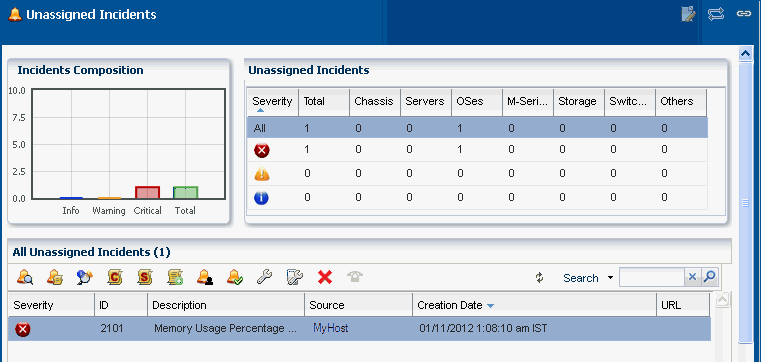
You can view details about unassigned incidents in the Unassigned Incidents queue in the Message Center. The Message Center displays the composition of incidents, the severity level for different types of assets with the severity status icon. It displays all unassigned incidents with Severity, Incident ID, Incident Description, Incident Source, Incident Creation Date, and URL. Hover your mouse on an unassigned incident to view details such as Duration, Assigned Date, Suggested Actions, Owner, Source and so on.
Figure 3-3 shows the unassigned incidents in the Message Center.
Figure 3-3 Unassigned Incidents in Message Center
Description of "Figure 3-3 Unassigned Incidents in Message Center"
You can view incidents that are assigned to you in the My Incidents queue of the Message Center. A bar chart in the Incidents composition section displays the number of new incidents by severity. The page also displays a table that categorizes the incidents by severity and type of asset. You can select an incident in the All My Incidents section to perform the following operations.
-
View Alerts: View the alerts that comprise an incident.
-
View Annotations: View all comments and notes created by alerts and any operation related to the incident. You can also view any suggested actions associated to the type of incident.
You can edit or delete the annotations that you have created. An administrator has the privileges to edit or delete any annotation.
-
View Possible Impacts and Causes: View the possible causes and impacts of an incident.
-
View Comments: You can view all comments associated with the selected incident. You can also add a comment to an incident.
-
View Suggested Actions: You can view all actions in the Incident Knowledge Base that are related to the incidents, and any actions entered specifically for the incident through Add Annotation. To include the suggested action in the Incident Knowledge Base, select the check box "Save this annotation in the Incident Knowledge Base to associate the annotation with all incidents of this type and severity".
-
Assign Incidents: You can assign one or more incidents to the user. The table enables multiple selection of incidents to be assigned to the user.
-
Add Annotation to Incidents: You can add a comment or a suggested action to one or more incidents. When you add a suggested action, you can add an associated Operational Plan to the suggested action. Then save and execute it.
-
Acknowledge Incident: Acknowledging an incident changes the state of one or more incidents to Acknowledged to indicate you are investigating. This action relocates the selected incidents to the My Incidents category.
-
Take Action on Incidents: Indicates that you can take appropriate action on one or more incidents of the same type, with the same attribute.
-
Mark Incidents as Repaired: It moves the state of one or more incidents to "Being Repaired". When an incident is in a state of "Being Repaired" no actions should be taken upon it.
-
Close Incidents: When you close an incident, the continued monitoring creates a new incident.
-
Open Service Requests: Opens a service request for the incident. You must be connected to My Oracle Support through the user interface to open a service request.
Similarly, you can view the incidents that are assigned to others by clicking Incidents Assigned to Others.
Message Center facilitates in viewing all your open service requests. You can view the service requests that are opened by others.
Oracle Enterprise Manager Ops Center generates notifications for all event operations and when the set thresholds are exceeded. Message Center lets you delete a selected notification or delete all notifications.
Below the title bar, a set of icons summarizes the Incident status, as shown in Figure 3-4. The icons from the left are Unassigned Critical Incident, Unassigned Warning Incident, All Relayed Incident, My Critical Incident, and My Warning Incident. The number next to each icon indicates the count of incidents for the particular status. Hold or hover the mouse cursor over the icon to view information that identifies the most recent incident. These icons keep you updated of the incident status while you perform other operations. Figure 3-4 shows the incidents count in the masthead of Oracle Enterprise Manager Ops Center. These icons appear at the top of the Navigation pane in the user interface.
Figure 3-4 Incidents Count in the Masthead
Description of "Figure 3-4 Incidents Count in the Masthead"
To view more information about the incidents, click these incident icons. They redirect you to the corresponding category in the Message Center. For example, clicking the Unassigned Warning Incident icon below the title bar redirects you to Message Center and displays detailed information about those number of Warning Unassigned Incidents in the center pane. Similarly, when you click Unassigned Critical Incident, it redirects you to Message Center and displays detail about the Critical Unassigned Incidents. From here double-click the selected incident to view details such as Summary, Membership Graph, Status, Compliance Reports and so on. For more information about Incidents, see Oracle Enterprise Manager Ops Center Feature Reference Guide.
3.4 Navigation Pane
The Navigation pane contains the following sections:
-
Message Center: Message Center displays and manages incidents, generates notifications, displays service requests, and the warranty information of an asset.
-
Assets: Assets list all the assets of Oracle Enterprise Manager Ops Center. Assets display standard views, user-defined groups, and resource management views. In the case of server pools, Assets also governs the virtualization hosts' placement and migration, and the server pool's networks and storage.
-
Plan Management: Plan Management displays Deployment Plans and Profiles that install, provision, and update one or more servers in Oracle Enterprise Manager Ops Center. It also displays Monitoring Policies, Operational Plans, Incidents Knowledge Base, and the credentials that are used in Oracle Enterprise Manager Ops Center.
-
Networks: Networks display all the networks that are discovered, declared, and created in Oracle Enterprise Manager Ops Center. It also displays discovered fabrics.
-
Libraries: Software libraries stores images and operating system updates components (policies and profiles). Storage libraries list different NAS, iSCSI, and FC storages that are known to Oracle Enterprise Manager Ops Center.
-
Reports: Reports lists the various types of reports that you can create, such as Operating System Reports, Incident Reports, and Firmware Reports.
-
vDC Management: vDC Management contains and manages a set of physical resources, and makes them available as virtual resources to virtual datacenter accounts.
-
Administration: Administration performs administrative functions, such as user administration, logs, and the status of service, including the version and upgrades available for the Agent.
Only the Administrator of Oracle Enterprise Manager Ops Center can access the Administration section. The administrator can change any configuration for the Enterprise Controller, Proxy Controllers, LDAP directories, users, and so on.
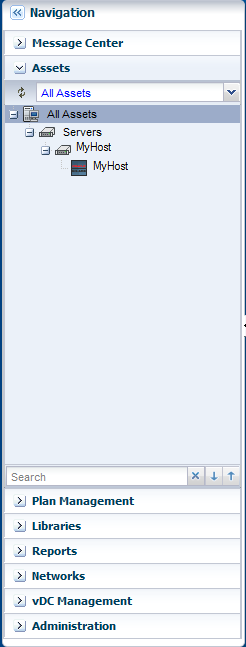
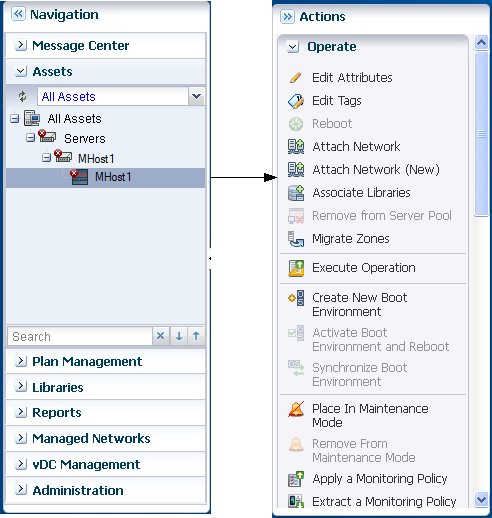
Click the right-arrow next to the section title to open the section and see its available resources and options. You can open only one section at a time. Figure 3-5 shows the Assets section of the Navigation pane.
Figure 3-5 Assets Section of Navigation Pane
Description of "Figure 3-5 Assets Section of Navigation Pane"
When a new asset is discovered, or when a job or a task is completed, the information changes in Oracle Enterprise Manager Ops Center, and the user interface refreshes automatically. When you do not see the new asset in the Assets pane, click the Refresh symbol in the Asset section of the Navigation pane to get the latest lists of assets. Similarly, click the Refresh symbol in the Jobs pane to view the latest list of jobs.
Oracle Enterprise Manager Ops Center, manages the Asset section of the Navigation pane that lists all the assets grouped by its type. You can choose one of the following views to see the lists of assets.
-
Standard Views: Use the All Assets view to display all managed assets of every type. To filter the view to display one type of asset, use one of the other standard views: Operating Systems, Chassis, and Servers. Click the plus symbol to expand the associated assets.
-
Resource Management Views: Use Resource Management View to filter the assets in the form of Server Pools, Storage, Racks, Oracle Solaris Cluster, and Oracle Engineered Systems.
-
User Defined Groups: Use the User Defined Group to filter the assets according to user definitions. When you create a group, this customized list becomes the new default view. A list shows a hierarchy of assets.
An icon represents the status of each asset. These icons distinguish one type of asset from another type. A quick scan of the asset hierarchy displays the servers that have a Linux operating system or an Oracle Solaris operating system, and also finds any unconfigured assets.
In an Asset hierarchy, an incident associated with an asset is notified by a badge that appears next to the asset icon. Badges show the current status of each asset like running, shutdown, locked, and suspended. When the incident is of a high priority in the membership group, the badge appears next to the parent asset in the asset hierarchy. The system removes the badge after the incident is acknowledged, marked repaired, or closed.
For more information about Badge icons, see Appendix A, "Icons."
Note:
Badges are special types of icons that describe the type of incident associated with the asset.Along with the assets, the Navigation pane displays all other elements such as, plans and profiles, networks, libraries of images and data, reports, and administrative functions. Expand the right arrow on the title bar to view the hierarchy of these items.
The center pane displays information according to your selection in the Navigation pane. The center pane is where you do most of the work. To increase the size of the center pane, close the Navigation pane. Click the left double-arrow in the title bar of the Navigation pane, to collapse the pane. To select another asset, expand the Navigation pane again by clicking on the right double-arrow.
For example, when you select the Server node of Assets section in the Navigation pane, the center pane displays the information about the Managed Members, and Unmanaged Members. Under the Server node, when you select a server, the center pane displays information about the Server's Hardware, Incidents, Service Requests, Rules, Jobs, Configurations, and Summary details. When you select the Operating System in the Asset section of Navigation pane, the center pane displays the Analytics, Incidents, Terminal, Storage, Jobs, Configuration, and the Summary of the Operating System.
Similarly, when you select All Assets node in the Assets section, the Action pane displays options to create, find, and add assets. When you select Server in the Assets section, the Actions pane displays the related actions to Execute Operation, Edit Tags, Refresh and so on. Further selection of the operating system in the Assets section of Navigation pane displays operations related to the operating system like Creating New Boot Environment, Executing Operation, Attach New Network, Edit Tags, Edit Attributes, and so on.
Note:
The tabs and information displayed in the Center pane and the Actions pane change, depending on what asset is selected in the Navigation pane.Figure 3-6 shows the details of the assets that are displayed in the center pane of the user interface of Oracle Enterprise Manager Ops Center.
Figure 3-6 Details of Asset Displayed in the Center Pane
Description of "Figure 3-6 Details of Asset Displayed in the Center Pane"
3.5 Center Pane
Center pane is the preliminary overview of the assets when no asset is selected in Oracle Enterprise Manager Ops Center. Each section represents the types of assets in a different type of chart. To identify the asset or asset type, hover the mouse on that portion of the chart. Figure 3-7 shows the pictorial representation of center pane.
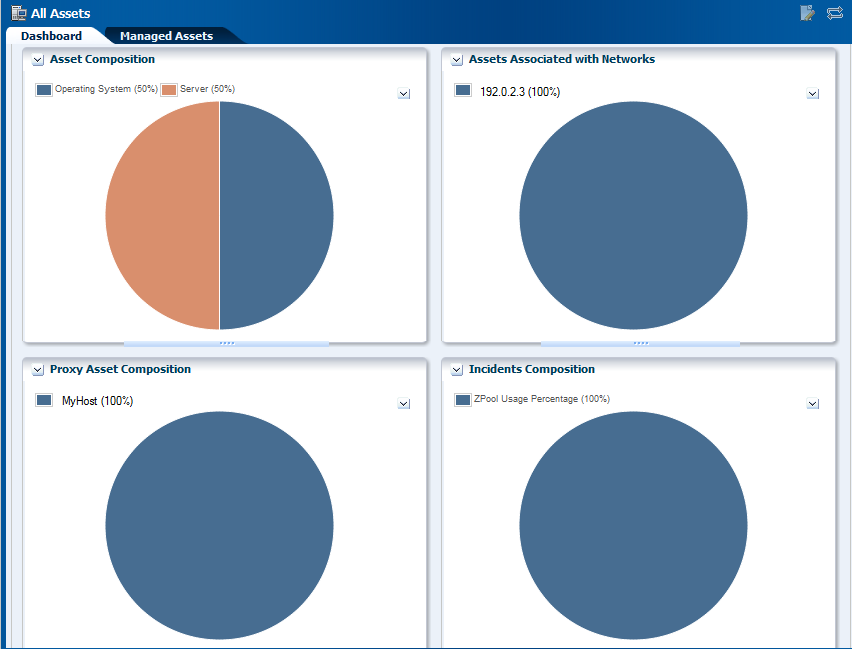
Any selection in the Navigation pane changes the display in the center pane. For most types of assets, the center pane shows a dashboard of standard information about the selected asset, a Membership Graph that shows its relationships, and a status summary that includes information about the unassigned incidents.
Allow time for the information to finish loading in the Membership Graph, depending on the complexity of your selection. Use the scroll bars to view all the information. For some types of assets, you need to click the right double-arrow button to view all the tabs.
You can edit, and refresh the details of an asset that are displayed in the center pane. Click Edit icon to edit the summary details of the selected asset in the Summary tab of the center pane. Commit the changes by clicking the Save icon or Cancel to ignore any change. A pop-up message displays information about the successful commit in the application.
The center pane also has icons that perform an action on the selected item, depending on the section selected in the Navigation pane. These icons are View Alerts, Close Incidents, Open Service Requests, Add User, Manage User Roles and so on.
Some types of assets have additional sections such as Services, Status, Compliance Reports, and File Systems. You can collapse these sections to hide the display and to prevent the information from refreshing. Click the down-arrow in the corner of the section to hide the section. Click the resulting right-arrow to reveal the section.
Click the Refresh symbol in the upper-right corner of the center pane to view any new information.
Click the Refresh symbol in Oracle Enterprise Manager Ops Center when you want to get the latest information. The Refresh feature is available at all the drawers of the Navigation pane, center pane, Actions pane, and so on. Figure 3-8 shows the Refresh icon in the right side corner of center pane and in Membership Graph.
3.5.1 Tabs
Some sections of the Navigation pane display their details in the form of tabs in the center pane. With your setting preference, you can set up any tabs in an object to be the default tab. Dashboard or Summary can be the default tab for those selected sections.
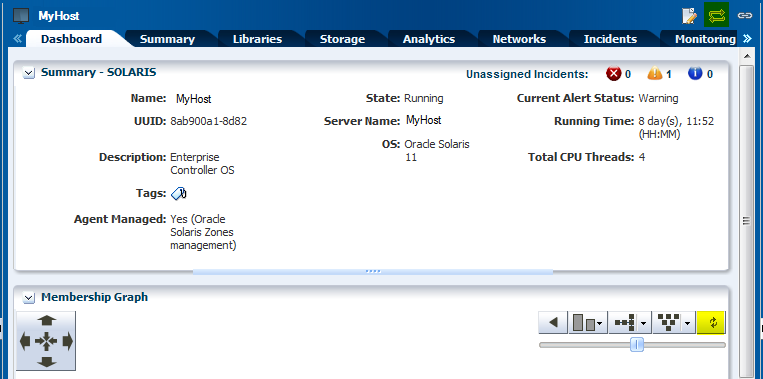
In case of assets selected as a section, the Dashboard tab displays a high-level overview of the asset. Every group and managed asset has a dashboard tab that provides a Summary, a Membership Graph, and the Monitoring status. The Dashboard tab displays additional information, depending on the type of asset selected in the section.
Dashboard enables you to customize your display preference by changing the position and height, or by collapsing or expanding any panel of the dashboard. The set preference is saved and used at the time of your next login.The same display preference is applied to other dashboards of the same type for other assets. For example, when you move the Status panel to the top for a dashboard of the selected server, at your next login, you find the Status panel at the same new location. When you select another server, you find the Status panel at the same new location of the dashboard.
When you select a group of assets, the Summary tab describes about all members of a group, and charts to identify the most active and least active members. To know more about the asset, click one of the tabs. Click the right double-arrow button to view the remaining tabs when there are too many tabs to fit into the center pane. Hold or hover the mouse over the value in the table to see its definition.
Charts are included in the Dashboard, Summary, and the Charts tab. Charts give access to the data collected by Oracle Enterprise Manager Ops Center for all the assets all the time. Hover the mouse over a portion of the chart to view the value it represents. On the Dashboard, you can hide the legend for a chart and the chart itself. Hide the legend when you want to see more details in the chart. Hide the entire chart to focus on another part of the center pane. Click the down-arrow button to hide and click the right-arrow button to show.
The Charts tab, display different types of charts. Right-click one of the charts to display a submenu of the following actions to customize the chart:
-
Select to pick a point on the line and display its values.
-
Zoom to concentrate on a portion of the chart.
-
Move to change the location of the chart.
-
100% to restore the original chart.
-
Select All
-
Property to display a table of all the values in the chart. You can control the scope of the chart by increasing or decreasing the time period of the data collection.
You can export your chart data in one of the following formats:
-
CSV
-
XML
Select one of the following time period to export your chart data.
-
Current View
-
6 months
The display of the tabs change in the center pane depending on the type of asset selected in the Navigation pane. For example, the display of tabs change in center pane when a hardware asset or an operating system is selected. Center pane displays some common tabs such as Dashboard, Monitoring, Jobs, and so on. On the selection of an asset in the Navigation pane, the center pane displays information about incidents in Incidents tab. You can view the alerts, incidents composition, and the unresolved incidents for the selected asset.
Administrating Enterprise Controller displays its information in various tabs like Summary, Configuration, Storage Libraries, Proxy Controller, and Logs.
You can select a template to view the template details or create a deployment plan from the templates tab in Plan Management. Existing Deployment Plans tab helps you in viewing a collection of profiles and plans that enables using the software to perform the tasks needed to maintain, monitor, and manage the infrastructure of your datacenter.
Oracle Enterprise Manager Ops Center uses libraries to store and manage cached data, images, packages, and metadata. It displays all its information through Summary, Usage, Disks, Incidents, and Monitoring tabs.
Networks describe about the network domains that are created. The Dashboard tab summarizes details about the network type, MTU, IP Range, Bandwidth, status of unassigned incidents, and recent incidents. The Network Details tab displays information about the Network IP, Netmask, Network Type, Network Name, and various other information about the network domain. Other tabs of Managed Network that provide more information about the network domain are IP Address Allocator, Network Services, Network Connections, Incidents, and Monitoring.
3.5.2 Membership Graph
The Dashboard tab is the default display of the center pane, and the Membership Graph is a part of the Dashboard tab. The Membership Graph shows the relationships between the assets that are selected. Depending on what you select in the Navigation pane and on your datacenter's organization, the Membership Graph can have a single object or multiple objects. To control the view, you can use these options:
-
Use the scroll bar for moving the display and bringing the assets in large graphs into view.
-
Use view controls to relocate the Membership Graph left and right, and up and down. These view controls are two sets of arrows: four inward arrows and four outward arrows. Click one of the outward arrows to relocate the Membership Graph. Click one of the inward arrows to center the graph in the center pane.
-
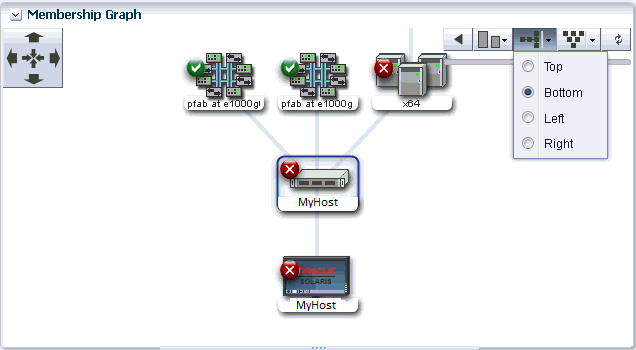
Use the orientation controls to change the orientation of the graph. The hierarchy can be presented from the top down or from the bottom up. If the hierarchy is flat and wide, a more convenient display might be to change to a horizontal display so that the top is now on the left or right. Click the left arrow to restore the display.
-
Drill into the graph. When you choose assets or a group at the top of a hierarchy, the Membership Graph consolidates the display of the assets so that the graph is not unwieldy. Click in the graph to show the actual members.
Hover your mouse on the desired icon in the Membership Graph to view details about the type of asset like name, description, type, and tags. Double-click the icon in the Membership Graph to reach that asset in the Navigation pane and also view its detailed description in the Dashboard tab of center pane.
For an incident, the warning, and critical icons appear next to the asset. These icons also appear as a badge on the asset and the asset group in the Navigation pane. Figure 3-9 shows the pictorial representation of the Membership Graph.
Click the Refresh icon in the upper right corner to refresh the Membership Graph.
See the section Establishing Your Account Preferences for more information about setting the default display preferences for Membership Graph.
3.6 Actions Pane
The Actions pane manipulate assets, and releases commands. Your selections in the Navigation pane or center pane change the display of operations in the Actions pane. Depending on the selection of asset in the Navigation pane, the set of available actions changes in the Actions pane. To see the available actions for an asset at any time without selecting it, right-click the asset in the Navigation pane. This is also convenient when the Actions pane is closed and only the icons for the actions are displayed.
Figure 3-10 shows the pictorial representation for the available action icons for an asset.
Figure 3-10 Available Actions Icons for an Asset
Description of "Figure 3-10 Available Actions Icons for an Asset"
The Actions pane is further subdivided into four sections – Operate, Organize, Deploy, and Update. An action is unavailable only when:
-
you have not selected an asset to perform that action. For example, to perform an action on a server's operating system you must select the operating system. The action is unavailable until you select the operating system asset that is listed under the server.
-
your role does not permit the action.
The Actions pane help you run an operation, edit tags, place the asset in maintenance mode, organize an asset to defined groups, manage assets and installing and deploying a Server on the type of selection of an Asset.
At any time, when you are not running commands, you can increase the size of the center pane by hiding the Actions pane. In the Action pane's title bar, click the right double-arrow to collapse the pane. The icons for the available actions are displayed without text. Hover your mouse over the available action icons in the collapsed state to view the action names. To select another action, click its icon or expand the pane by clicking on the left double-arrow button to be able to select the names of the actions. Figure 3-11 shows the actions for an asset.
3.7 Jobs Pane
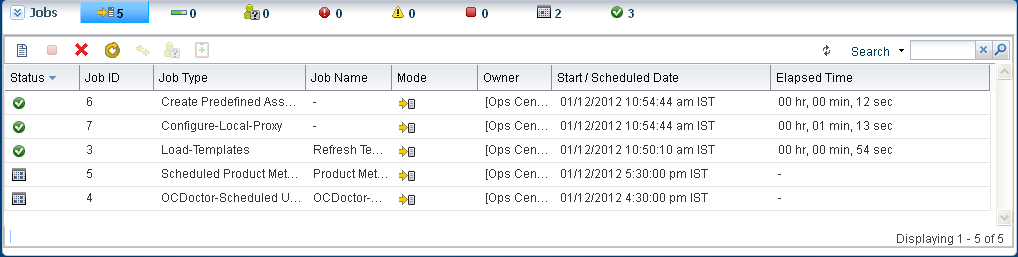
Every action creates a job. The Jobs pane at the bottom of the user interface displays a count of all jobs according to the status of each job. To see the status type, hover the mouse over the Job icon. Some jobs have many steps. To view the progress of a job, select a job, and then click the View Job Details icon. Figure 3-12 shows the Jobs pane with succeeded jobs and scheduled jobs.
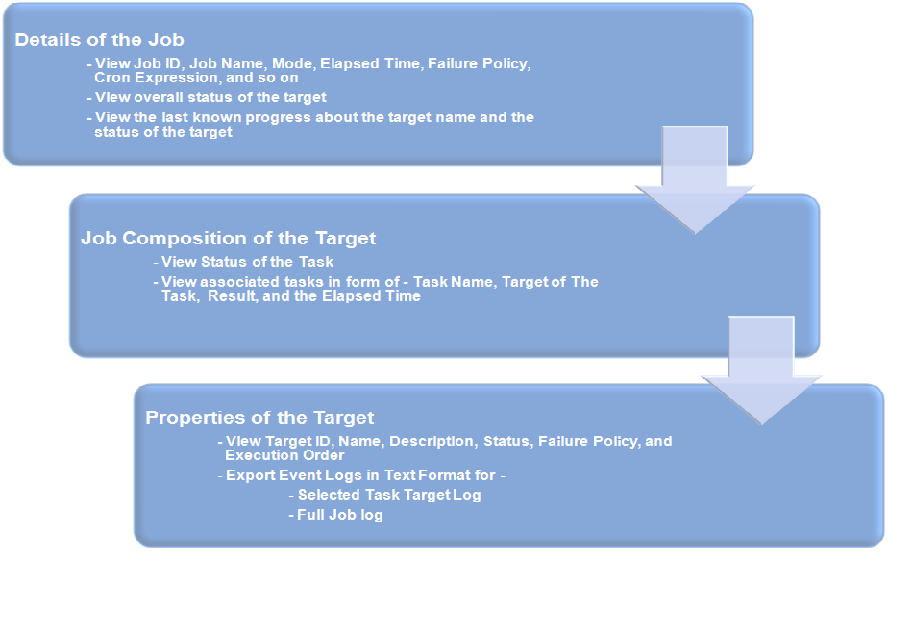
To know more information about a job, double-click a job. Click the right-arrow of Job Details to view a summarized information about Job ID, Job Name, Job Type, Mode, Failure Policy, Job Owner, and so on. You can view the Target Overall Status, Last Known Progress, and the Target Name. Jobs pane lets you re-run the selected failed target. Double-click the target to view all the associated tasks for that job. It displays Task Name, Target of The Task, Result, and the Elapsed Time. The status of the task is displayed as an icon. Double-click the task to view the task properties, and the event logs. Oracle Enterprise Manager Ops Center lets you export the logs of a job or a selected task target log in text format. Click the Refresh symbol at a desired point of time to refresh the user interface.
Figure 3-13 details out the steps of a job review.
At any point of time, you can Stop a Selected Job, Delete a Job, Copy a Job, Answer Questions for a Job, and Debug a Job through OCDoctor.
Some actions create the job immediately but often, you must provide more information to specify the job. These actions start a wizard to guide you through creating a job. The last page of wizard displays a summary of your specifications before you submit a job.
Oracle Enterprise Manager Ops Center displays all types of jobs. You can filter the jobs in various categories and view them. You can view the Jobs In Progress, Jobs awaiting for User Input, Failed Jobs, Partially Successful Jobs, Stopped Jobs, Scheduled Jobs, and the Successful Jobs.
The other details of job includes Status, Job ID, Job Type, Job Name, Mode, Owner, Elapsed Time, and Start/Scheduled Date. Oracle Enterprise Manager Ops Center also provides a search facility for jobs on these details. The search functionality displays results according to your search criteria. You can click the Refresh icon to view the latest information for jobs.
The Jobs pane, when collapsed, displays the Status Icons, the Count for All Jobs, Jobs In Progress, Jobs Waiting For User Input, Jobs failed, Jobs Partially Successful, Jobs Stopped, Jobs Scheduled, and Jobs Successful.
3.8 Searching in Oracle Enterprise Manager Ops Center
Oracle Enterprise Manager Ops Center provides various search options, such as:
-
In the global search field, in the upper-right corner of the user interface, you can search for any Network, Storage Library, or Asset.
-
In the Navigation pane, you can search for the asset. It highlights the first result in the asset navigation tree for your selection, and the Dashboard tab of the center pane displays information about the searched asset. Use the up and down arrows to view the next matching asset.
-
In the Navigation pane, select All Assets and click Managed Assets tab to search all assets or filter by assets type. You can further search for an asset.
-
In the Jobs pane, you can search for the jobs. Use the search function to filter the category of information you want to view.
3.9 Establishing Your Account Preferences
The software enables you to customize parts of the user interface to meet your preferences. Your personal preferences override the default preferences that are set for your role. To change your account preferences, click Setup and then My Preferences in the upper right corner of the UI.
Sign in and Start Page Preferences enable you to select any section of the Navigation pane to display as the default view each time you log in. The default is to expand the Assets section and display All Assets. For the Assets section, you can select a sub-option of assets, such as Engineered Systems, to display as the default view instead of All Assets. Another option is to display a section other than Assets, such as the Message Center or vDC Management, as the default view.
User Interface Preferences enable you to hide some sections from displaying in the Navigation pane, such as Libraries or Networks. You cannot hide the Assets and Administration sections. For the Assets section, you have the option to specify that the assets are always expanded or always collapsed and you can choose which tab to display as the default tab. For example, you might prefer to have the Summary page display as the default tab instead of the Dashboard tab. You can set values for Session Timeout, Console Session Timeout, Connectivity Check Interval, Table Refresh Frequency, and Job Status Popup Duration for Time Intervals.
Membership Graph Preferences enable you to set the display preferences for the orientation, icon size, and level of depth for the assets in Membership Graph. This feature is available beginning with the 12.2.2 release.
Users Preferences Summary displays a summarized history of the preferences that you have selected in My Preferences. You can view your set preferences for the start page, display, time intervals, asset default tab, and Membership Graph.