Using Rates with Your Activity-Based Management Model
While most activity-based costing systems calculate resource, activity, and cost object results using actual or budgeted historical data, Activity-Based Management offers capacity and frozen rates as well. This section discusses the following rate options for model types:
Actual
Budgeted
Capacity
Frozen
Combination
These rate options let you create and run basic, full-absorption models that have the following advantages:
They calculate variances from actual costs such as spending, volume, and capacity variances.
They attribute monetary amounts to entities that operate at greater than or less than their capacity.
They maintain a more constant consumption pattern over multiple time periods.
Actual Rates
Ledger mappers move actual amounts mapped from the general ledger into resource objects of the Activity-Based Management engine, which tracks data related to actual driver quantities:
Image: Calculating actual rates
Calculating actual rates.
The actual rate type assumes that operations are occurring at 100 percent capacity.
A rate represents a monetary amount divided by a driver quantity. To calculate an actual rate, Activity-Based Management applies the following formula to the values captured by the model:
(Actual Rate) = (Actual Monetary Amount) / (Actual Driver Quantity)
Note: This rate type can fluctuate temporarily with general ledger fluctuations and does not address capacity.
Budgeted Rates
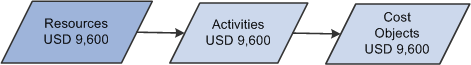
Ledger mappers move budgeted amounts mapped from the general ledger into resource objects of the Activity-Based Management engine, which tracks data related to budgeted driver quantities:
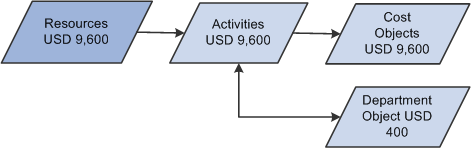
Image: Calculating budgeted rates
Calculating budgeted rates.
Because a rate represents a monetary amount divided by a driver quantity, Activity-Based Management calculates the budgeted rate by applying the following formula to arbitrary values captured by a model:
budgeted rate = budgeted amount / budgeted driver quantity
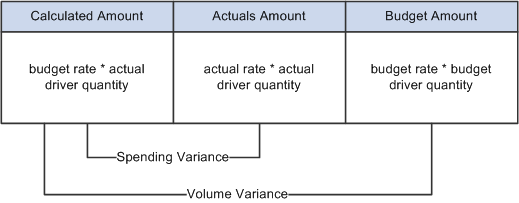
Determining both the actual and budgeted rates let you calculate two variance types:
|
Variance Type |
Calculation |
|---|---|
|
Volume |
(budgeted driver quantity - actual driver quantity) x (budgeted rate) |
|
Spending |
(budgeted rate - actual rate) x (actual driver quantity) |
As a result, you can calculate the following two types of variance results:
The combined results create the total variance. If you apply the budgeted rate calculated by the Activity-Based Management engine, only those values pass through the remainder of the model versus passing along the actual amount.
Image: Variance calculation for actual and budgeted rates
The following diagram illustrates how the system calculates volume and spending variance.
Note: As with the actual rate, the budgeted rate also does not address capacity and is subject to fluctuations based on general ledger fluctuations.
Capacity Rates
Actual and budgeted driver quantities can and do fluctuate over time; likewise, the actual and budgeted rates fluctuate over the same time period. Because decisions made on the basis of these fluctuating rates could be misleading, the concept of capacity rates becomes important.
When entities are not operating at their full capacity and all costs are applied to activities and cost objects, the model fully absorbs the costs and managers are forced to use historical information to make decisions.
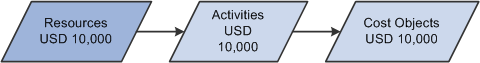
Activity-Based Management lets you assign the excess costs to a departmental cost object so that you can track excess capacity. Assigning excess capacity to such an object balances the actual amounts within the model, and the flow of amounts through the objects remains constant:
Image: Calculating capacity rates
Calculating capacity rates.
The capacity rate is the result of the budgeted amount divided by the capacity driver quantity:
capacity rate = (budgeted monetary amount) / (capacity driver quantity)
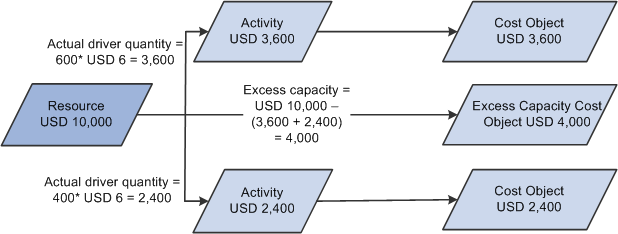
Example of a Capacity Calculation
Suppose that the actual resource cost mapped from the general ledger is 10,000 USD. Our actual driver quantity for activity 1 is 600 units; for activity 2 it is 400 units. In addition, suppose that the budgeted amount for the resource is 9,600 USD, and the capacity volume for the resource is 1,600.
The system calculates a capacity rate by dividing the budget amount value by the capacity volume quantity as follows:
9,600 USD / 1,600 = 6.00 USD
Values going to activity 1 and activity 2 are then calculated by multiplying the actual driver quantities by the capacity amount.
Activity 1 actual driver quantity = 600 x 6 USD = 3,600
Activity 2 actual driver quantity = 400 x 6 USD = 2,400
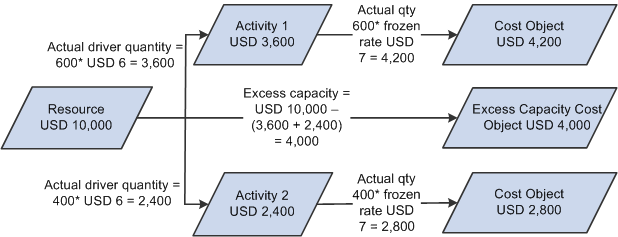
For the model to balance, the system places the excess amount in the departmental excess capacity cost object. The resource total is 10,000 USD while activities total 6,000 USD. The system places the remaining 4,000 USD in the excess capacity cost object:
Image: Capacity rate calculation example
Example of capacity rate calculation.
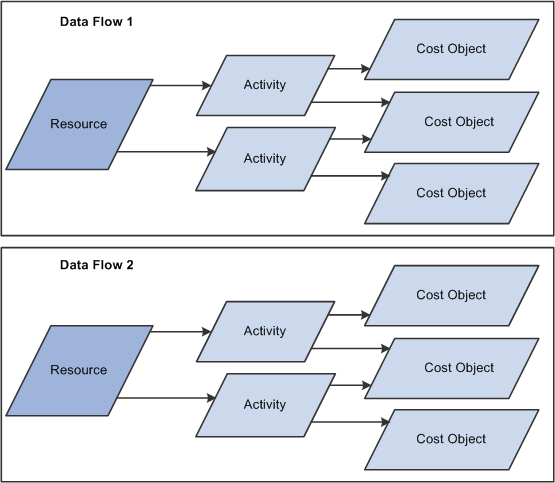
When defining the model, it is important to determine where in the data flow the capacity calculation will occur. You can calculate capacity at either the resource or activity driver level in a single data flow. It cannot exist in both the resource driver and activity driver levels of a single data flow. A model can consist of several data flows.
Image: Example of an Activity-Based Management model with two data flows
The following diagram illustrates a single model containing two data flows where data flow 1 could have the calculation occur at the resource driver level and data flow 2 could have the calculation occur at the activity driver level.
Frozen Rates
A frozen rate is fixed and agreed upon outside the context of the Activity-Based Management model:
Image: Calculating frozen rates
Calculating frozen rates.
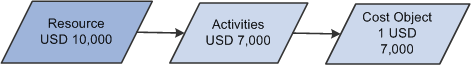
Example of a Frozen Rate Calculation
Using a frozen rate lets you calculate variances from actual, budgeted, or capacity values. Because information about the driver quantity is not used to calculate the rate, the variance is not divided between spending and volume:
Image: Frozen rate calculation example
Example of frozen rate calculation.
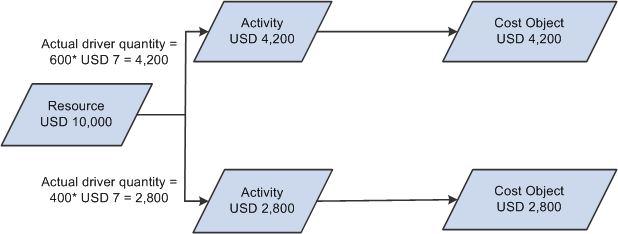
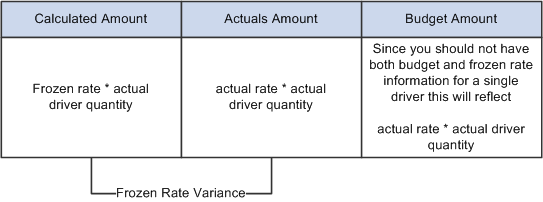
Image: Frozen rate variance calculation
The following diagram shows the variance calculation using a frozen rate.
Combination Rates
Combination rates let you combine a mixture of actual, budgeted, capacity, and frozen rate information. Here's an example of the calculation of data flow for a combination model:
Image: Calculation data flow example for a combination model type
Calculation data flow example for a combination model type.