Using Activity-Based Management Trend and Variance Analysis
Activity-Based Management features two tools enabling you to analyze you model results:
Activity-Based Management Trend Analysis.
Activity-Based Management Variance Analysis.
Understanding Activity-Based Management Trend Analysis
Activity-Based Management Trend Analysis enables you to compare trend results from any Activity-Based Management scenario over a specified time frame. Using this feature you can:
Specify the model criteria to use for the comparison.
Specify the scenario and the number of periods you want to include in the trend analysis.
Display Activity-Based Management trees using tree control functionality for the specified model.
Drill through the tree using the tree control or a gird.
View details of the Activity-Based Management model in a chart and grid format.
Understanding Activity-Based Management Variance Analysis
Activity-Based Management Variance Analysis enables you to compare results between:
Two different models from the same or different periods.
Two different time periods for the same model.
The actual, budget, and calculated fields for the same model and time period.
The actual, budget, and calculated fields for a different model and time period.
As with Activity-Based Management Trend Analysis, you can:
Specify the model criteria to use for the comparison.
Display Activity-Based Management trees using tree control functionality for the specified model.
Drill through the model using the tree control or via the grid.
View details for the variance results in chart and grid format.
Pages Used to View Trend and Variance Data
|
Page Name |
Definition Name |
Navigation |
Usage |
|---|---|---|---|
|
Trend Analysis selection criteria |
AB_TREND_SRCH |
|
Enter search criteria for the scenario and periods you want to analyze. |
|
Trend Analysis |
AB_TREND_MAIN |
Click the Do analysis link on the Trend Analysis selection criteria page. |
View the trend data based on the selection criteria and drill down into greater detail. |
|
Variance Analysis selection criteria |
AB_VAR_SEL_PAGE |
|
Enter search criteria for the models, periods, and calculation types you want to compare using this tool. |
|
Variance Analysis |
AB_VAR_MAIN_PAGE |
Click the Do analysis link on the Variance Analysis selection criteria page. |
View the variance data based on the selection criteria and drill down into greater detail. |
Using the Trend Analysis and Variance Analysis Components
The Trend Analysis and Variance Analysis components are very similar in their structure and behavior.
Entering Selection Criteria
When you first access the components you enter selection criteria to specify which scenario, model, or combination of both, to compare. These pages vary slightly and are described later in this section.
Trend Analysis and Variance Analysis Data Display
Once you have entered your search criteria, select the Do analysis to transfer to the main Trend Analysis or Variance Analysis report page. Each of these pages is laid out as follows.
On the top left is the tree control. This is based on the tree specified in your search criteria (resource, activity, or cost object).
To the right of the tree control is a chart display of the results based on the criteria you entered. Above the chart, a summary of your selection criteria displays.
Below the chart is a grid listing objects based on your selection criteria.
Using the Tree Control
You can use the tree control to drill down through the model. Simply expand or collapse the tree and select any node to navigate to different information. The chart and grid display change based on your selection. The tree displayed is the tree attached to the object type you specify in your selection criteria.
Using the Grid
You can also use the grid at the bottom of the pages to drill down through the model. Select any of the objects listed to drill down a level. For example, if you select a cost object, you will drill down to view the activities for that cost object. The chart display and grid display change based on your selection.
Trend Analysis Selection Criteria Page
Use the Trend Analysis selection criteria page (AB_TREND_SRCH) to enter search criteria for the scenario and periods you want to analyze.
To analyze trend data:
Enter the Number of Periods to Trend. The system will analyze the trend data over this number of periods, enabling you to compare two or many periods.
Specify the Object Type to use as the starting point for the analysis: Activity, Cost Obj. (cost object), or Resource.
The Tree Name for the object type you select displays.
Note: You must select an object type that has an attached tree in order to perform a trend analysis.
Click the Do analysis link to view the data returned based on your selection criteria.
You can also reset your scenario selection by clicking the Select new base link.
Trend Analysis Page
Use the Trend Analysis page (AB_TREND_MAIN) to view the trend data based on the selection criteria and drill down into greater detail.
Image: Trend Analysis page
This example illustrates the fields and controls on the Trend Analysis page.
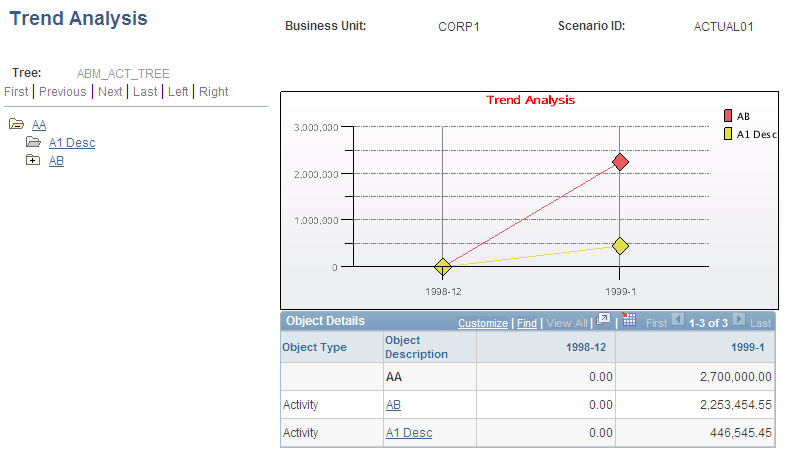
The grid display has the following columns:
The chart displays the column amount data in graphic form enabling you to view the trend for the data. The chart display changes based on the objects you're viewing.
To change your selection criteria or enter new criteria, click the Choose scenario link to return to the Trend Analysis selection criteria page.
Variance Analysis Selection Criteria Page
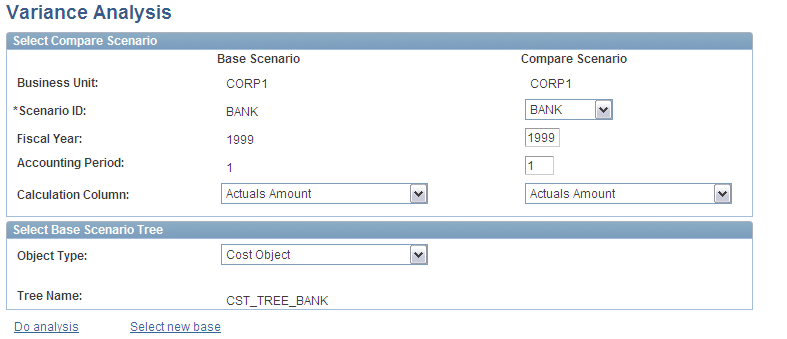
Use the Variance Analysis selection criteria page (AB_VAR_SEL_PAGE) to enter search criteria for the models, periods, and calculation types you want to compare using this tool.
Image: Variance Analysis selection criteria page
This example illustrates the fields and controls on the Variance Analysis selection criteria page.
To analyze variance data:
The Base Scenario fields display the settings you selected for opening this page. You can change the Calculation Column to include a different calculation type in your analysis: Actuals, Budgeted, or Calculated.
In the Compare Scenario column, select the Scenario ID of the model you want to use for the comparison. This can either be the same scenario if you want to compare a different fiscal year and period, or a different calculation type, or an entirely different scenario.
If you are comparing the model amounts, for example (such as actuals versus budgeted, actuals versus calculated, or budgeted versus calculated) specify these settings in the Calculation Column drop-down list box.
In the Select Base Scenario Tree group box, specify the Object Type that you want to use as the starting point for the analysis: Activity, Cost Obj. (cost object), or Resource. The Tree Name for the object type you select automatically displays.
Note: You must select an object type that has an attached tree in order to perform a variance analysis.
Click the Do analysis link to view the data based on your selection criteria.
You can also reset your scenario selection by clicking the Select new base link.
Variance Analysis Page
Use the Variance Analysis page (AB_VAR_MAIN_PAGE) to view the variance data based on the selection criteria and drill down into greater detail.
Image: Variance Analysis page
This example illustrates the fields and controls on the Variance Analysis page.
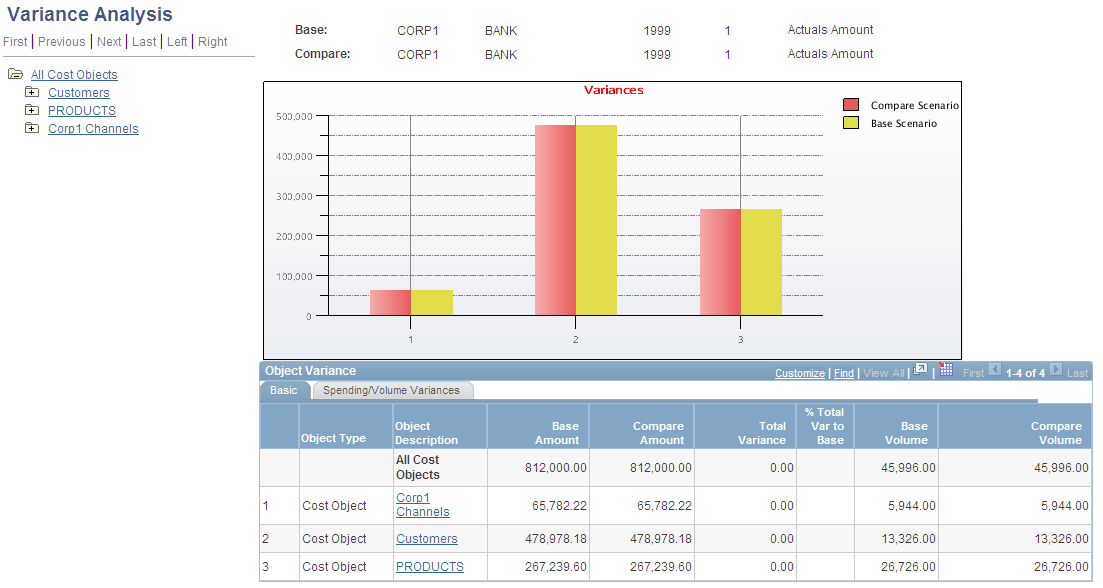
The Object Type column displays the objects currently selected using the tree control or grid. The Object Description column displays descriptions of the objects as links that you can use to drill down to linked objects. For example, clicking on a cost object description enables you to drill down to view the activities that drive this cost object.
For each object listed, the grid displays the Base Amount and the Compare Amount. It also displays the Total Variance as both an amount and a percentage, and you can also view the Base Volume and the Compare Volume.
Click the Spending/Volume Variances tab to view the Spending Variance and Volume Variance both as an amount and percentage.
The following formulas are used to calculate the variance amounts:
|
Variance Amount |
Formula |
|---|---|
|
Total variance |
base amount � compare amount |
|
Percent total variance to base |
(total variance / base amount) * 100 |
|
Volume variance |
(base volume � compare volume) * (base amount / base volume) |
|
Percent volume variance to base |
(spending variance / base amount) * 100 |
|
Spending variance |
((base amount / base volume) � (compare amount / compare volume)) * compare volume |
|
Percent spending variance to base |
(volume variance / base amount) * 100 |
The chart displays the grid data in graphic form enabling you to view the variance for the data.
To change your selection criteria or enter new criteria, click the Choose scenario link to return to the Variance Analysis selection criteria page.