Using Online Reporting and Analysis
The delivered online analysis reports perform a read-only lock against the activity data to which you have access, as defined by the user role name and the security group associated with the activity scenario being accessed. The dimensions available in the line item activity analysis reports are determined by those defined for the planning model and activity scenario selected for reporting. The analysis reports for position and asset data only provide the account dimension, but contain additional parameters specific to these two types of reports.
The following sections discuss how to:
Analyze position data.
Analyze asset data.
Analyze variance.
Compare budget versions.
Pages Used for Online Reporting and Analysis
|
Page Name |
Definition Name |
Navigation |
Usage |
|---|---|---|---|
|
Position Budgeting Analysis |
BP_PBD_INQUIRY |
|
Specify parameters for an online position activity report and run the report. |
|
Position Budgeting Analysis |
BP_PBD_INQUIRY2 |
|
View a report based on the inquiry parameters you define on the Position Analysis page. Loads the report results to an analytic grid. |
|
Asset Analysis |
BP_AST_INQUIRY |
|
Specify parameters for an online asset activity report and run the report. |
|
Asset Analysis |
BP_AST_INQUIRY2 |
Click the Run button on the Asset Analysis page. |
View a report based on the inquiry parameters you define on the Asset Analysis page. Loads the report results to an analytic grid. |
|
Variance Analysis |
BP_LI_VAR_INQUIRY |
|
Specify the parameters for an online budget comparison across versions and historical periods. |
|
Variance Analysis |
BP_LI_VAR_INQUIRY2 |
Click Run on the Variance Analysis page. |
View a report based on the inquiry parameters you define on the Variance Analysis page. Loads the report results to an interactive analytic grid. |
|
Version Analysis |
BP_LI_VER_INQUIRY |
|
Specify the parameters for an online report that compares budget versions. |
|
Version Analysis |
BP_LI_VER_INQUIRY2 |
Click the Run button on the Version Analysis page. |
View a report based on the inquiry parameters you define on the Version Analysis page. Loads the report results to an analytic grid. |
Position Budgeting Analysis Page
Use the Position Budgeting Analysis page (BP_PBD_INQUIRY) to specify parameters for an online position activity report and run the report.
Use the online inquiry page to access and load position activity data to an analytic grid for analysis. You can access cost and FTE data by account, position, job code, and employee.
Note: You must have access to the position activity to run the analysis report.
Image: Position Budgeting Analysis page
This example illustrates the fields and controls on the Position Budgeting Analysis page.
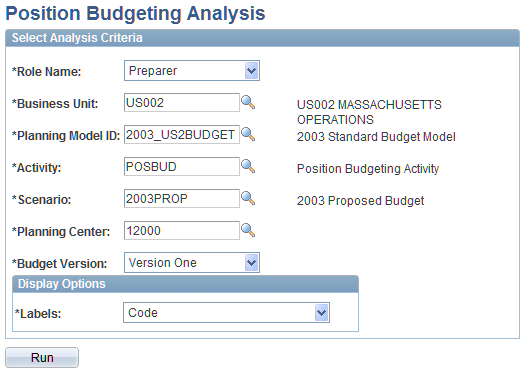
Specify the parameters for the report by entering the Role Name, Business Unit, Planning Model ID, Activity, Scenario, Planning Center, and Budget Version. Select the row and column headings in the Labels field. The Labels options are Code, Code and Description, or Description.
Click Run to generate the report online.
Report Results
When you execute the report the system displays the results in an analytic grid.
Image: Position Budgeting Analysis results page
This example illustrates the fields and controls on the Position Budgeting Analysis results page. You can find definitions for the fields and controls later on this page.
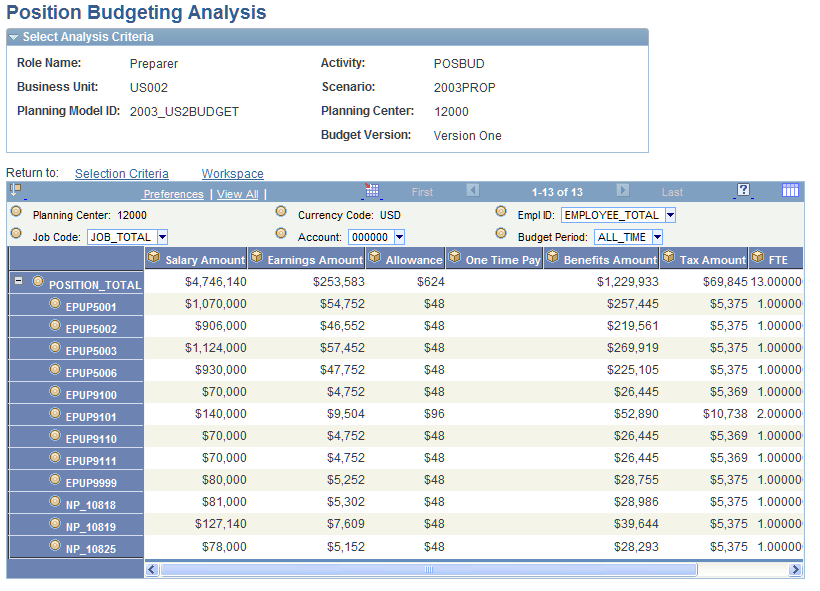
In the analytic grid you can modify the view of the data by dragging any dimension from the row axis to the slicer bar or column axis, and by dragging cubes from the column axis to the slicer bar or row axis.
When viewing data by budget period, the results reflect the spread ratio defined by the Spread ID assigned to the position. Positions selected as Exclude from Budget Calc on the Position Data page may appear in the Position Analysis report. However, the budget amounts and FTE associated with the positions are excluded. These values are zeroes for positions selected as Exclude from Budget Calc.
Note: If the report errors out when you run it, then dimension leveling may be an issue; that is, you may have accounts with data stored at more than one level on the dimension tree. For that reason, you should only import data at the detail level and not at the node level.
Asset Analysis Page
Use the Asset Analysis page (BP_AST_INQUIRY) to specify parameters for an online asset activity report and run the report.
Use the online inquiry page to access and load asset activity data to an analytic grid for analysis. You can access data on an asset, asset account, capital acquisition plan, capital acquisition sequence, or asset catalog item.
When viewing the asset data, the system automatically performs a checkout of the asset information, temporarily placing a read-only lock on the data in PS_BP_ASSET and PS_BP_ASSET_DEPR for the planning center under review. Asset inquiries are based on the data contained in those records.
Note: You must have access to the Asset activity to run the analysis report.
Image: Asset Analysis page
This example illustrates the fields and controls on the Asset Analysis page . You can find definitions for the fields and controls later on this page.
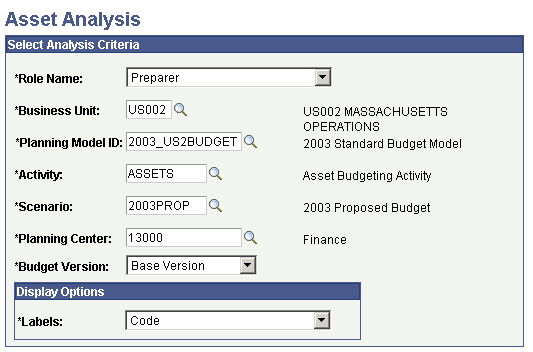
Specify the parameters for the report by entering the Role Name, Business Unit, Planning Model ID, Activity, Scenario, Planning Center, and Budget Version ID. Specify the row and column headings in the Labels field.
Click Run to generate the report online.
Report Results
When you execute the report the system displays the results in an analytic grid.
Image: Asset Analysis results page
This example illustrates the fields and controls on the Asset Analysis results page. You can find definitions for the fields and controls later on this page.
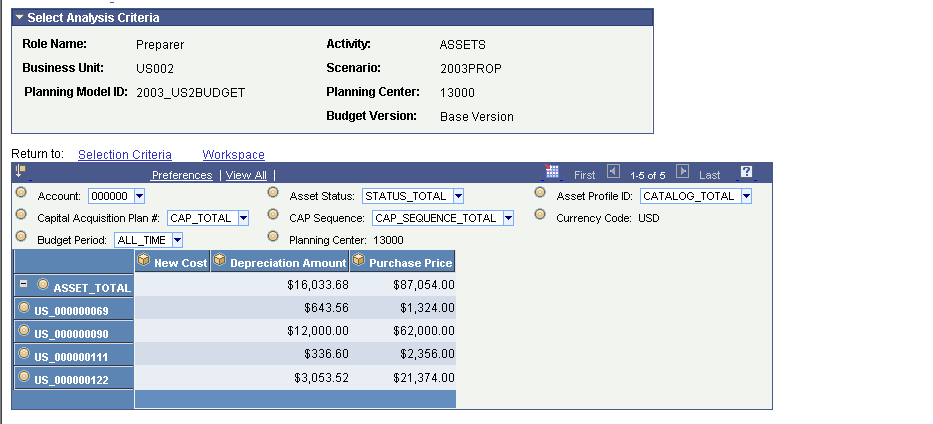
In the analytic grid you can modify the view of the data by dragging any dimension from the row axis to the slicer bar or column axis, and by dragging cubes from the column axis to the slicer bar or row axis.
Note: Assets selected as Exclude from Budget Calc on the Asset Data page may appear in the Asset Budgeting Inquiry report. However, the budget amounts associated with the asset are excluded.
Note: If the report errors out when you run it, then dimension leveling may be an issue; that is, you may have accounts with data stored at more than one level on the dimension tree. For that reason, you should only import data at the detail level and not at the node level.
Variance Analysis Page
Use the Variance Analysis page (BP_LI_VAR_INQUIRY) to specify the parameters for an online budget comparison across versions and historical periods.
Use the online inquiry page to access and load line item activity data to an analytic grid for analysis. You can compare any two scenarios for a single activity and planning center in the planning model. The scenarios are further qualified by selecting the versions and time periods for each scenario.
Note: You must have full access to the Line Item Budgeting activity for your planning center to run these analysis reports. When you click Run the system checks whether you have full access to the planning center version. If you have only partial access, the system displays an error message that you cannot run this report unless you have access to every account in this planning center.
For line item analysis, Planning and Budgeting uses the analysis calculation definition that you enter for account types on the Account Type Options page. Depending on the calculation rules that you define, the system adds or subtracts account values that you include in the analysis and stores the results in the totals field. For example, if you deduct expense accounts and add revenue accounts during analysis calculations, the total reflects revenues minus expenses.
Image: Variance Analysis page
This example illustrates the fields and controls on the Variance Analysis page. You can find definitions for the fields and controls later on this page.
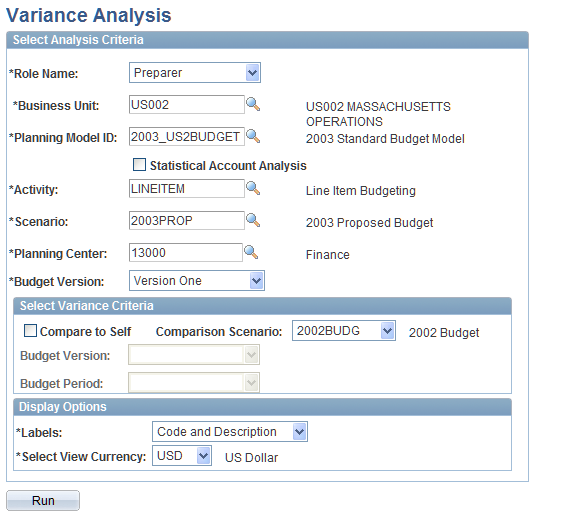
Specify the parameters for the report on this page.
Click Run to generate the report online.
Report Results
When you execute the report the system displays the results in an analytic grid.
Image: Variance Analysis results page
This example illustrates the fields and controls on the Variance Analysis results page. You can find definitions for the fields and controls later on this page.
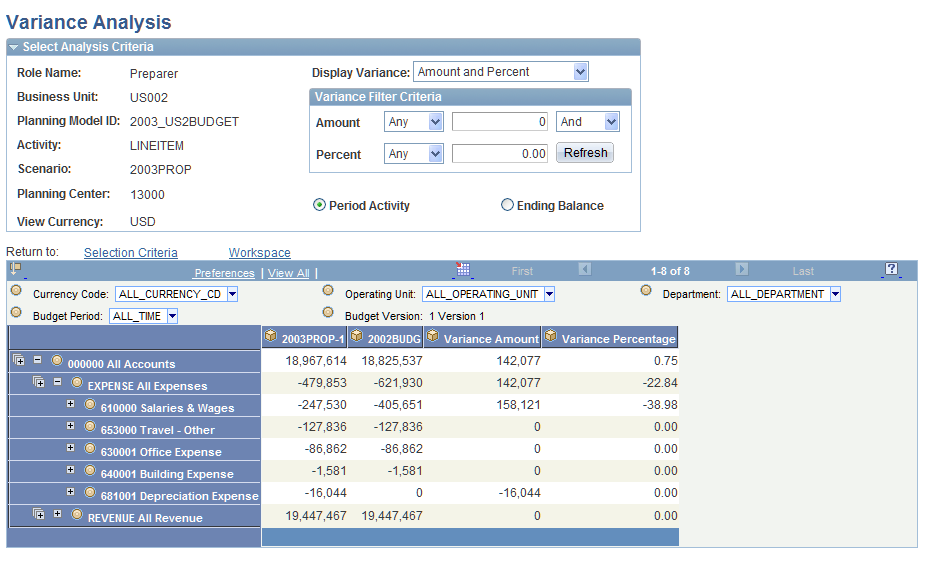
In the analytic grid you can modify the view of the data by dragging any dimension from the row axis to the slicer bar or column axis, and by dragging cubes from the column axis to the slicer bar or row axis.
The available dimensions are based on the selected dimensions for the activity.
Variance Analysis Page
Use the Variance Analysis page (BP_LI_VAR_INQUIRY2) to view a report based on the inquiry parameters you define on the Variance Analysis page.
Loads the report results to an interactive analytic grid.
Use the online inquiry page to access and load line item activity data to an analytic grid for analysis. You can compare all versions for a single activity, scenario and planning center in the planning model.
Note: You must have full access to the Line Item Budgeting activity for your planning center to run these analysis reports. When you click Run the system checks whether you have full access to the planning center version. If you have only partial access, the system displays an error message that you cannot run this report unless you have access to every account in this planning center.
For line item analysis, Planning and Budgeting uses the analysis calculation definition that you enter for account types on the Account Type Options page. Depending on the calculation rules that you define, the system adds or subtracts account values that you include in the analysis and stores the results in the totals field. For example, if you deduct expense accounts and add revenue accounts during analysis calculations, the total reflects revenues minus expenses.
Image: Version Analysis page
This example illustrates the fields and controls on the Version Analysis page. You can find definitions for the fields and controls later on this page.
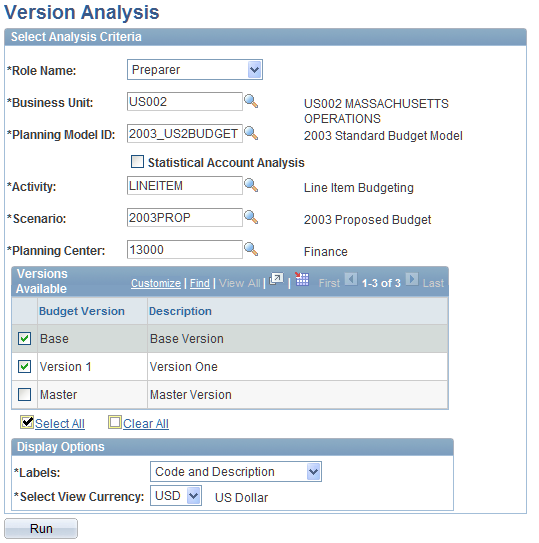
Specify the parameters for the report on this page.
Click Run to generate the report online.
Report Results
When you execute the report the system displays the results in an analytic grid.
Image: Version Analysis results page
This example illustrates the fields and controls on the Version Analysis results page. You can find definitions for the fields and controls later on this page.
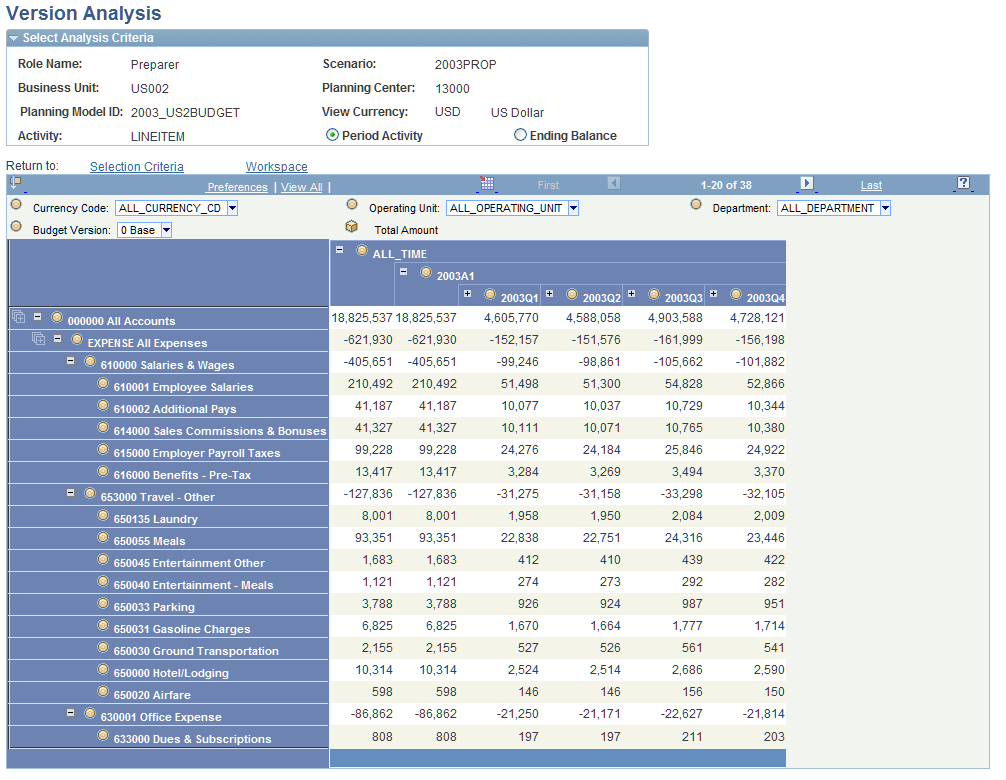
In the analytic grid you can modify the view of the data by dragging any dimension from the row axis to the slicer bar or column axis, and by dragging cubes from the column axis to the slicer bar or row axis.
The available dimensions are based on the selected dimensions for the activity.