DataStage Designer Overview
The DataStage Designer is the primary interface to the metadata repository and provides a graphical user interface that enables you to view, edit, and assemble DataStage objects from the repository needed to create an ETL job.
An ETL job should include source and target stages. Additionally, your server job can include transformation stages for data filtering, data validation, data aggregation, data calculations, data splitting for multiple outputs, and usage of user-defined variables or parameters. These stages allow the job design to be more flexible and reusable.
DataStage Designer enables you to:
Create, edit, and view objects in the repository.
Create, edit, and view data elements, table definitions, transforms, and routines.
Import and export DataStage components, such as projects, jobs, and job components.
Analyze the use of particular items in a project.
Edit and view user-defined object properties.
Create jobs, job sequences, containers, and job templates.
Create and use parameters within jobs.
Insert and link stages into jobs.
Set stage and job properties.
Load and save table definitions.
Save, compile, and run jobs.
DataStage Designer Window
The DataStage Designer window, which is the graphical user interface used to view, configure, and assemble DataStage objects, contains the following components:
Repository Window: Displays project objects organized into categories. By default, the Repository window is located in the upper left corner of the Designer window. The project tree displays in this pane and contains the repository objects belonging to a project.
Tool Palette: Contains objects that you add to your job design, such as stage types, file types, database types, and processor objects. You can drag these objects from the Palette into the Diagram window. By default, this window is displayed in the lower left corner, of the Designer window. This window appears to be empty until you open or create a job.
Diagram Window: Serves as the canvas for your job design. You drag, drop, and link stages and processor objects to create jobs, sequencers, and templates.
Property Browser: Displays the properties of the currently selected stage of the job that is open in the Diagram window. By default, this window is hidden. To open it, select View, Property Browser from the menu bar, and then click a stage to see its properties.
The following diagrams show the layout of the DataStage Designer window components:
Image: DataStage Designer Window - Layout View
This diagram illustrates thelayout view of the DataStage designer window.
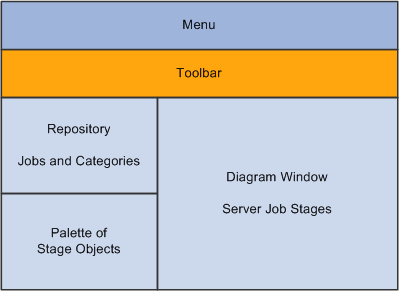
Image: DataStage Designer Window
This example illustrates the DataStage Designer Window.
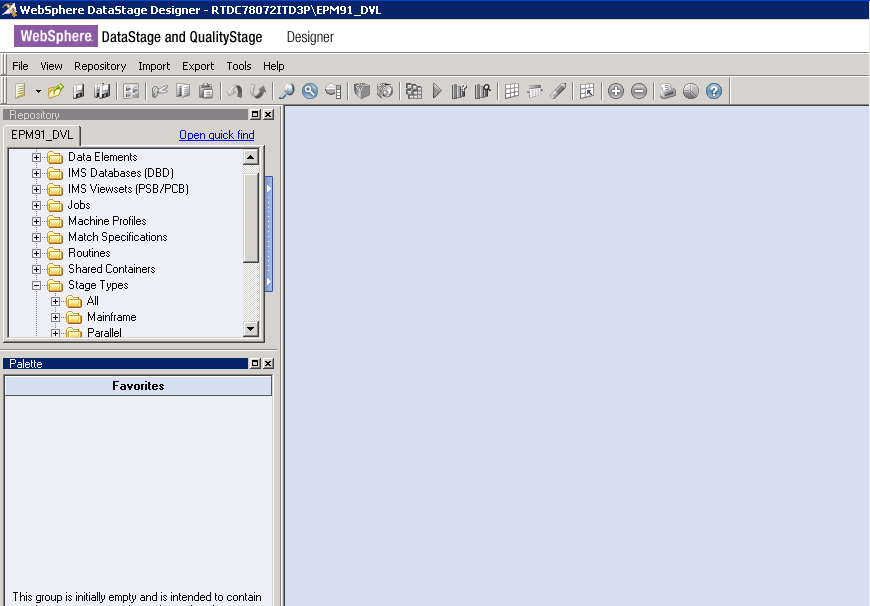
The display area is in the right pane of the DataStage Designer window and displays the contents of a chosen object in the project tree.
By Default, the Designer window contains the Repository window, Tool Palette, and Diagram window. You can optionally view the Property Browser by selecting View, Property Browser from the menu bar .
The display of Designer windows and toolbars can be shown or hidden by selecting the appropriate option from the View menu. You can dock, undock, or rearrange the Designer windows.
Designer Menus
Most Designer menu items are also available in the toolbars. The following are some additional options that are available through the menus:
|
Designer Menu Item |
Description |
|---|---|
|
View, Customize Palette |
Customize your palette. |
|
View, Property Browser |
Enables you to view and edit properties of a DataStage object. |
|
Import |
Enables you to import ETL projects, jobs, or other components that you export from another system, as well as DataStage components, such as table definitions, from text files or XML documents. |
|
Export |
Enables you to export DataStage objects in the form of text files with the file extension .dsx. |
|
Tools, Run Multiple Job Compile |
Enables you to compile all your jobs at the same time. |
|
Tools, Run Director |
Invoke the Director module, and log you into your project automatically. |
Designer Toolbar
The Designer toolbar displays the following buttons:
Image: DataStage Designer Toolbar
This example illustrates the DataStage Designer Toolbar.

This table describes the Designer toolbar buttons:
|
Designer Toolbar Button |
Description |
|---|---|
|
New |
Open the New window where you can open a new DataStage object. |
|
New (arrow down button) |
Display options associated with the New command on the toolbar. |
|
Open |
Display the Open window that enables you to open an existing or recently opened repository object. |
|
Save |
Save the current job or container. |
|
Save All |
Save all open jobs or containers. |
|
Job Properties |
Open the Job Properties window for the current job open in the Diagram window. |
|
Cut |
Cut a specific object or text and temporarily stores it. |
|
Copy |
Copy a specific object or text and temporarily stores it. |
|
Paste |
Paste the temporarily stored object or text. |
|
Undo |
Undo the last task performed. |
|
Redo |
Redo the last task performed. |
|
Quick Find |
Search for DataStage objects using the quick find feature. |
|
Advanced Find |
Search for DataStage objects using the advanced find feature. |
|
Data Flow Analysis |
Use this function to display the data lineage for a column definition to see where in the job design that the column definition is used, display the source of the data for selected column or columns, display the target for the data for selected column or columns. |
|
Construct Local Container |
Create a local job container. |
|
Construct Shared Container |
Create a shared container reusable by other jobs. |
|
Compile |
Compile the current job. |
|
Run |
Run the current job. |
|
Grid Lines |
Show or hide a grid in the Diagram window. |
|
Link Markers |
Show or hide markers on the links. |
|
Toggle Annotations |
Show or hide annotations in the diagram window. You enter annotations by dragging the Annotation object from the Palette. |
|
Stage Validation errors |
See visual cues for parallel jobs or parallel-shared containers. The visual cues display compilation errors for every stage on the canvas, without you having to actually compile the job. The option is enabled by default |
|
Snap to Grid |
When the grid is shown and Snap to Grid is enabled, align objects that you drag with the grid. |
|
Zoom In |
Magnify the diagram display. |
|
Zoom Out |
Shrink the diagram display. |
|
|
Print the current diagram window. |
|
Generate Report |
Generate an HTML report of a server, parallel, or mainframe job or shared container. You can view this report in a standard Internet browser. |
|
Help on View |
View context-sensitive help. |
Debug Toolbar
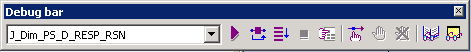
The Debug toolbar provides basic functions for testing and troubleshooting your jobs.
The Debug toolbar can be accessed by selecting View, Debug and displays the following buttons:
Image: Debug Toolbar
This example illustrates the Debug Toolbar.
This table describes the Debug toolbar buttons:
|
Debug Toolbar Button |
Description |
|---|---|
|
Set target debug job |
Enables you to select the job you want to debug. |
|
Start/Continue Debugging |
Start or stop running in debug mode. |
|
Next Link |
Run the job until you come to the next link. |
|
Next Row |
Run until you get to the next row. |
|
Stop Job |
Stop the job run. |
|
Set debug Job Parameters |
Set job parameters. |
|
Edit Breakpoints |
Change breakpoints (pauses that you have inserted into the run). |
|
Toggle Breakpoints |
Enable or disable breakpoints. |
|
Clear All Breakpoints |
Clear breakpoints. |
|
View Job Log in Director |
Open the job log in the Director module. |
|
Show/Hide Debug Window |
Display or hide the debug window. |
All of the Debug toolbar options are also available from the Debug menu.