Understanding Dashboards for the FMS Warehouse
The prebuilt dashboard and reports packaged for the FMS Warehouse provide you with an overview of key profit and loss results, and an early warning of a possible revenue shortfall, and cost of sales or expense overrun. You can manage expenses against the budget and forecast, and know immediately if there is an overspending potential.
PeopleSoft provides dashboards that map to the following FMS Warehouse data marts:
Enterprise Service Automation
General Ledger and Profitability
Payables
Receivables
Commitment Control Dashboard
The prebuilt dashboard and reports packaged for the FMS Warehouse provide you with an overview of current budgets and enable you to identify transactions associated with budgets, generate internal budget reports, manage expenses against the budget and forecast, and know immediately if there is an overspending potential.
The Commitment Control dashboard can help answer:
What is my budget balance with and without encumbrances?
What portion of my budgets were still encumbered at year-end and why?
What remaining balances were rolled from the prior year?
Which of my budgets typically ends the year with balances that are rolled?
What is the budget to actuals variance average across a five year period?
Which budgets are being supplemented by revenues and by how much?
Grants Dashboard
The Grants dashboard enables you to perform detailed analysis of the activities associated with grant proposals, awards, and award funding. The Grants dashboard is designed for director-level staff members who manage the overall grants process and oversee principle investigators and grant proposal writers.
The Grants dashboard provides functionality related to the following analytic subject areas:
Pre award (proposal) analysis
Awards analysis
Award activities analysis
Using the Grants dashboard you can:
Determine your success rate and overall ability to obtain grant funding.
Analyze the activity associated with budgets, expenditures, and sponsor billing for recovering costs. Expenditures includes payroll costs, benefit costs, employee expenses, equipment and supplies that are purchased, services that are contracted out to other entities and other miscellaneous spending that occurs.
Evaluate performance of the staff responsible for investigating and submitting proposals, and managing award funds.
Pre Award (Proposal) Analysis
The pre award, or proposal, subject area supports analysis of proposal success rate, proposal processing, and helps answer:
What outstanding proposals do I have and how much funding do they represent?
What are the funding requests by department and/or principal investigator?
What is the processing time from submission to funding?
What are the budgets defined for my research proposals?
What portion of the proposed budgets are direct costs versus indirect costs?
What F&A amounts are associated with my proposal budgets?
Which proposals include cost-sharing budgets with other institutions?
What is the total amount of proposals that were rejected versus funded?
What amounts were budgeted vs. awarded vs. proposed?
Awards Analysis
The Awards subject area supports analysis of grant awards, award trends, spending and revenue activity, and helps answer:
How do this year's awards compare to last year's awards?
Which project budgets, billing, receivables, and expenditures relate to the award?
How successful are the principal investigators in getting grants awarded?
What has been awarded, to date, for a particular research program?
What sponsor awards have funded a particular research program?
Award Activities Analysis
The Award Activities subject area supports analysis of the funding, billing, and receiving associated with an award, and helps answer:
What are the award funds spent to date?
What are the budget amounts and actual expenditures for the fiscal or budget period?
What is the breakdown of actual expenses by analysis type and group?
What is the breakdown of actual expenses by department?
Reviewing Drill Down Information in Grants Reports Charts and Graphs
Some Grants reports have interactive charts and graphs that enable you to review drill down information for a particular dimension. In these reports you can select a specific dimension from the chart and review a new report based on the specific drill down information for that dimension. For example, in the Proposals by Department report you can click the Sponsor Direct Amount column for the Biology Department to review related drill down information:
Image: Drilling on Sponsor Direct Amount for the Biology Department
This example illustrates the fields and controls on the Drilling on Sponsor Direct Amount for the Biology Department. You can find definitions for the fields and controls later on this page.
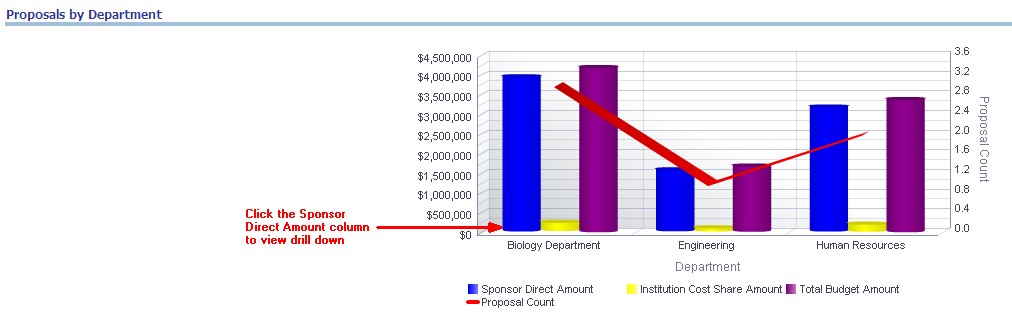
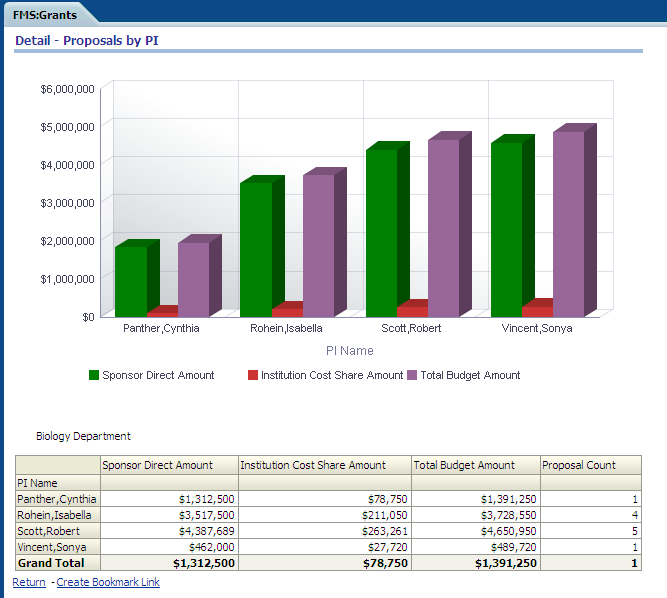
Image: Viewing the drill down report for Sponsor Direct Amount for the Biology Department
This example illustrates the fields and controls on the Viewing the drill down report for Sponsor Direct Amount for the Biology Department. You can find definitions for the fields and controls later on this page.
The following Grants reports enable you to review drill down information:
Proposal Success Rate
Proposal Success Rate by PI
Proposals by Department
Delivered Security Groups
This list contains the financials-oriented Oracle BI Server and Oracle Presentation Catalog security groups provided for the FMS Warehouse:
Accounts Payable Manager
Accounts Receivable Manager
Costing Manager
Finance Manager
Project Manager
Property Manager