CRM: Admissions and Recruiting - Overview Page
Use the Recruiting and Admissions - Overview page to provide you with an overview of the Prospect to applicant to admit and enrollees' numbers, ratios and yields for your institution.
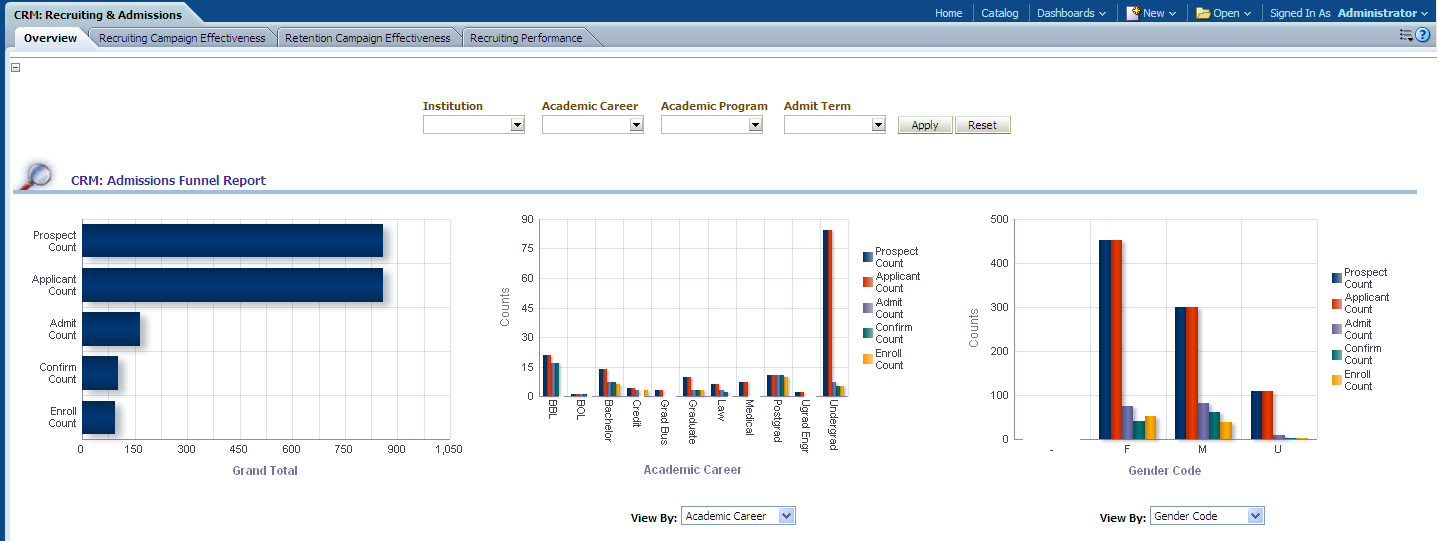
Image: CRM: Recruiting and Admissions dashboard
This example illustrates the fields and controls on the CRM: Recruiting and Admissions dashboard. You can find definitions for the fields and controls later on this page.
|
Usage |
Reports |
Dashboard Prompt |
|---|---|---|
|
Provides you with an overview of the Prospect to applicant to admit and enrollees' numbers, ratios and yields for your institution. |
This page includes the CRM: Admissions Funnel Report. |
Use the Admissions and Recruiting - Overview page prompt to filter page results by:
|
Admissions Funnel Report
Use the Admissions Funnel report, which provides you with an overview of student prospect, applicant, admit, and enrollment measures for your institution.
Image: Admissions Funnel report, part 1
This example illustrates the fields and controls on the Admissions Funnel report, part 1. You can find definitions for the fields and controls later on this page.
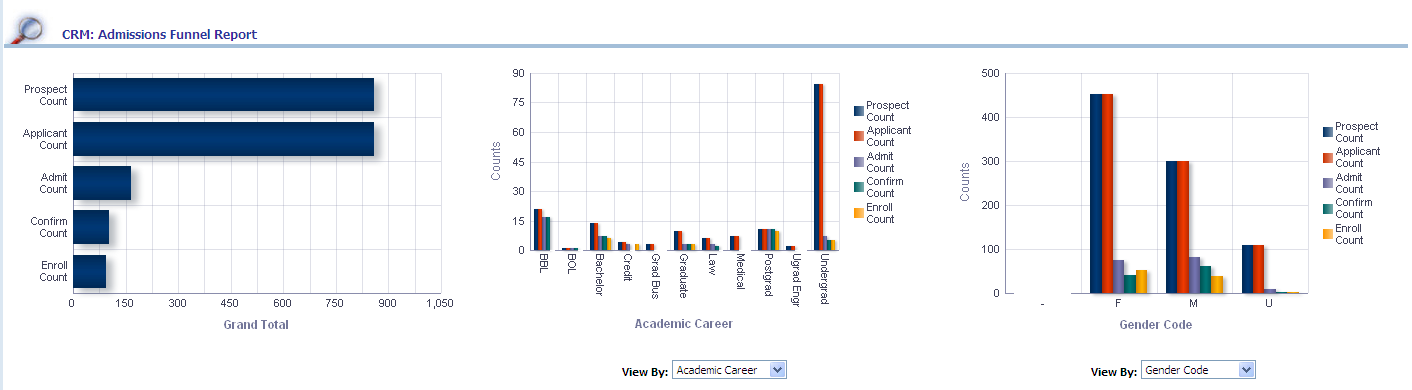
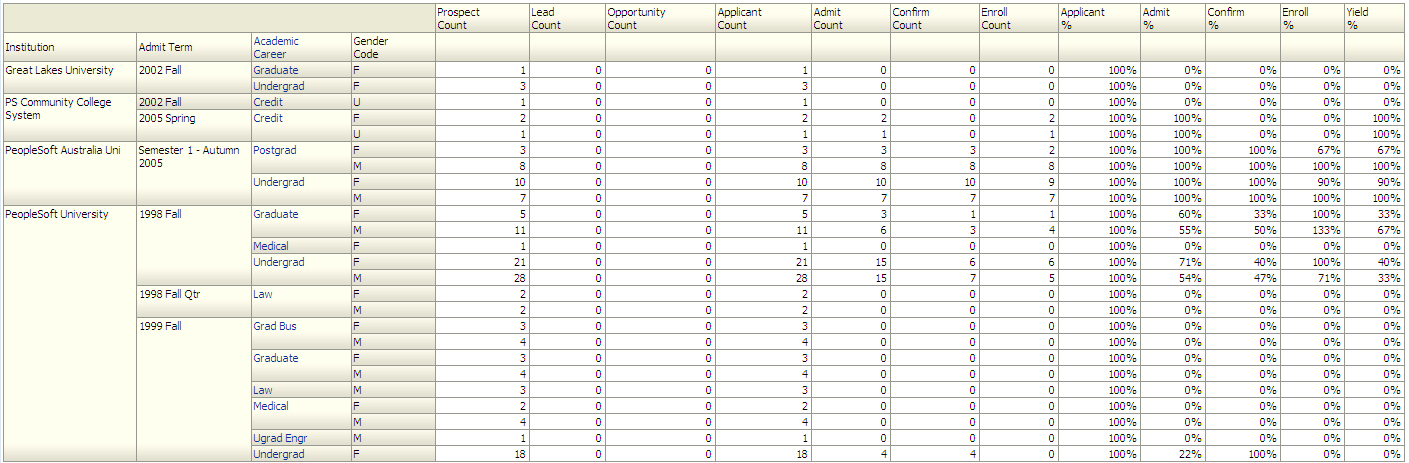
Image: Admissions Funnel report, part 2
This example illustrates the fields and controls on the Admissions Funnel report, part 2. You can find definitions for the fields and controls later on this page.
This report helps monitor different stages and statuses for constituents. It provides a snapshot for the given term to help users analyze the progression of constituents through the various stages and statuses of recruiting (Suspect > Prospect > Applicant > Admit > Confirmed > Enrolled Student) along with the achieved Conversion Rate between consecutive stages. The presented constituent's data can be sliced based on various dimensions like Admit Type, Referral Source, Gender, and so forth.
|
X,Y Axis Data for Bar Chart 1 |
X,Y Axis Data for Bar Chart 2 |
X,Y Axis Data for Bar Chart 3 |
|---|---|---|
|
The first Admissions Funnel graph displays Prospect Count, Applicant Count, Admit Count, Confirm Count, and Enrollment Count data on the x-axis and total count data on the y-axis. |
The second Admissions Funnel graph displays Academic Career data on the x-axis and Prospect Count, Applicant Count, Admit Count, Confirm Count, and Enrollment Count data on the y-axis. The x-axis can also display Academic Program, Academic Plan, Academic Load, Application Center, Ethnic Group, Last School Attended, Region, Gender Code, Admit Type, or Referral Source, depending on your View By filter selection. |
The third Admissions Funnel graph displays Region data on the x-axis and Prospect Count, Applicant Count, Admit Count, Confirm Count, and Enrollment Count data on the y-axis. The x-axis can also display Academic Program, Academic Plan, Academic Load, Application Center, Ethnic Group, Last School Attended, Region, Gender Code, Admit Type, or Referral Source, depending on your View By filter selection. |
|
View by Filter (Left) |
View by Filter (Right) |
|---|---|
|
Use this filter to view the second Admissions Funnel graph results by:
|
Use this filter to view the third Admissions Funnel graph results by:
|
|
Report Column / Measure Name |
Report Column / Measure Origin |
|---|---|
|
Academic Career |
Academic Career (D_ACAD_CAR) Dimension |
|
Academic Program |
Academic Program (D_ACAD_PROG) Dimension |
|
Academic Plan |
Academic Plan (D_ACAD_PLAN) Dimension |
|
Academic Load |
Academic Load (D_ACAD_LOAD) Dimension |
|
Application Center |
Application Center (D_APPL_CNTR) Dimension |
|
Ethnic Group |
Person (D_PERSON) Dimension |
|
Last School Attended |
External Organization (D_EXT_ORG) Dimension |
|
Region |
Region (D_REGION_CS) Dimension |
|
Gender Code |
Person (D_PERSON) Dimension |
|
Admit Type |
Admit Type (D_ADMIT_TYPE) Dimension |
|
Referral Source |
Referral Source (D_RFRL_SRC) Dimension |
|
Prospect Count |
Admission Funnel (F_ADM_FUNNEL) Fact |
|
Applicant Count |
CRM Funnel (F_CRM_FUNNEL_S or F_CRM_ FUNNEL) Fact (sourced from CRM system) |
|
Admit Count |
CRM Funnel (F_CRM_FUNNEL_S or F_CRM_ FUNNEL) Fact (sourced from CS system) |
|
Confirm Count |
CRM Funnel (F_CRM_FUNNEL_S or F_CRM_ FUNNEL) Fact (sourced from CS system) |
|
Enrollment Count |
CRM Funnel (F_CRM_FUNNEL_S or F_CRM_ FUNNEL) Fact (sourced from CS system) |
|
Applicant % |
(Applicant Count / Prospect Count) * 100 |
|
Admit % |
(Admit Count / Applicant Count) * 100 |
|
Confirm % |
(Confirm Count / Admit Count) * 100 |
|
Enrollment % |
(Enrollment Count / Confirm Count) * 100 |
|
Yield % |
(Enrollment Count / Admit Count) * 100 |