Recruiting Campaign Effectiveness Page
Use the Recruiting Campaign Effectiveness page to help managers and analysts can use the reports on this page to compare like campaigns
|
Usage |
Reports |
Dashboard Prompt |
|---|---|---|
|
Managers and analysts can use the reports on this page to compare like campaigns (such as comparing the Fall Undergraduate 2009 campaign to the Fall Undergraduate 2008 campaign) to identify which campaigns were more successful in enrolling students, which were more cost effective, and which gave better return on investment. |
This page includes the two reports:
|
Use the Recruiting and Admissions - Recruiting Campaign Effectiveness page prompt to filter page results by the following parameters.
|
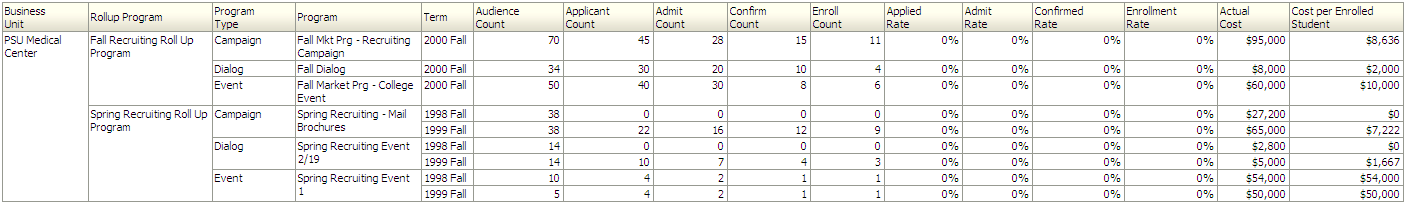
Rollup Programs (Recruiting) Report
Use the Rollup Programs report, which enables you to filter on the Business Unit, Term, and Rollup Program meant for recruiting. You can select the rollup programs to be compared.
Image: Rollup Programs (Recruiting) report, part 1
This example illustrates the fields and controls on the Rollup Programs (Recruiting) report, part 1. You can find definitions for the fields and controls later on this page.
![CRM_RollupPrograms[Recruiting]Report1](img/i-4642ab0fn-7dec.png)
Image: Rollup Programs (Recruiting) report, part 2
This example illustrates the fields and controls on the Rollup Programs (Recruiting) report, part 2. You can find definitions for the fields and controls later on this page.
![CRM_RollupPrograms[Recruiting]Report2](img/i-4642ab0fn-7ebb.png)
|
X,Y Axis Data for Bar Chart 1 |
X,Y Axis Data for Bar Chart 2 |
Measure Filter |
|---|---|---|
|
The first Rollup Programs graph displays Audience Count on the x-axis, and Rollup Program on the y-axis. |
The second graph displays Applied Rate data on the x-axis and Rollup Program data on the y-axis The x-axis can also display Admit Rate, Confirmed Rate, Enrollment Rate, or Actual Cost, depending on your Measure filter selection. |
Use this filter to view report results by the following measures:
|
|
Report Column / Measure Name |
Report Column / Measure Origin |
|---|---|
|
Audience Count |
Marketing Campaign (F_MKT_CMPGN_S) Fact |
|
Applicant Count |
Marketing Campaign (F_MKT_CMPGN_S) Fact |
|
Admit Count |
Marketing Campaign (F_MKT_CMPGN_S) Fact |
|
Confirm Count |
Marketing Campaign (F_MKT_CMPGN_S) Fact |
|
Enroll Count |
Marketing Campaign (F_MKT_CMPGN_S) Fact |
|
Applied Rate |
(Students Applied / Audience Count) * 100 |
|
Admit Rate |
(Students Admitted / Audience Count) * 100 |
|
Confirmed Rate |
(Students Confirmed / Audience Count) * 100 |
|
Enrollment Rate |
(Students Enrolled / Audience Count) * 100 |
|
Actual Cost |
The fact table has unit cost populated by ETL and is summarized by the report. |
|
Cost per Enrolled Student |
Actual Cost / Enroll Count |
Recruiting Programs Report
Use the Recruiting Programs report, which enables you to identify which campaigns are more successful in enrolling students, which were more cost effective, and which provide a better return on investment.
Note: You can also drill down from the Rollup Programs report to a specific rollup to compare programs associated with that rollup. When you drill down, the Recruiting Programs report is displayed. You can view the same report in the second section of the Campaign Effectiveness Page, where you can select the program type and the programs to be compared.
Image: Recruiting Programs report, part 1
This example illustrates the fields and controls on the Recruiting Programs report, part 1. You can find definitions for the fields and controls later on this page.
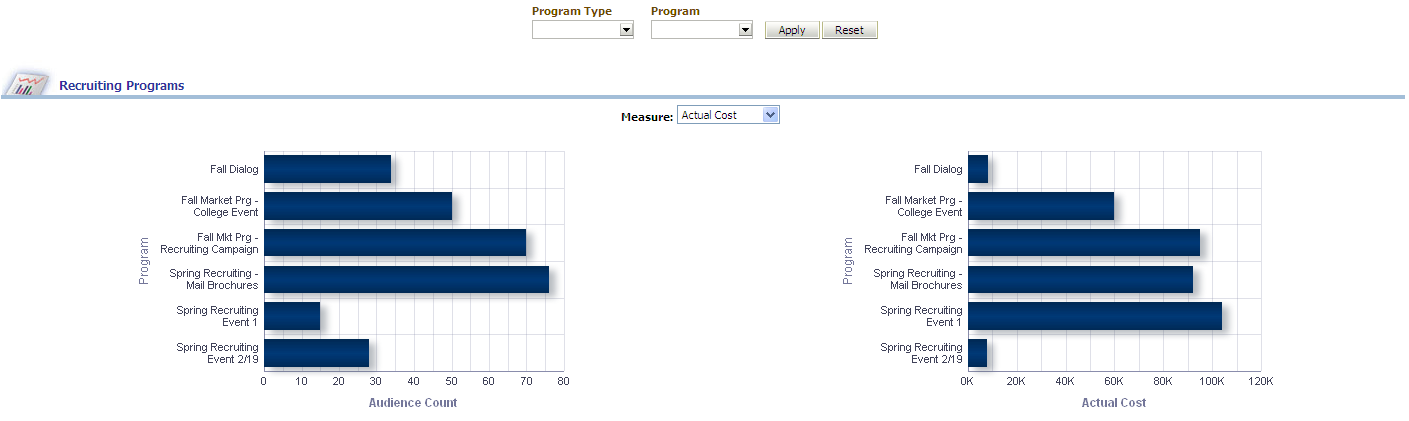
Image: Recruiting Programs report, part 2
This example illustrates the fields and controls on the Recruiting Programs report, part 2. You can find definitions for the fields and controls later on this page.
|
X,Y Axis Data for Bar Chart 1 |
X,Y Axis Data for Bar Chart 2 |
|---|---|
|
The first Recruiting Programs graph displays Audience Count data on the x-axis, and Program data on the y-axis. |
The second graph displays Actual Cost data on the x-axis and Program data on the y-axis. The x-axis can also display Applied Rate, Admit Rate, Confirmed Rate, or Enrollment Rate, depending on your Measure filter selection. |
|
Program Type Filter |
Program Filter |
Measure Filter |
|---|---|---|
|
Use this filter to view report results by the following program types: • (All results) • Campaign • Dialog • Not Available • Roll up |
Use this filter to view report results by the specific program. Available choices are filtered by your choice of Program Type. |
Use this filter to view report results by the following measures: • Applied Rate • Admit Rate • Confirm Rate • Enrollment Rate • Actual Cost (default) |
|
Report Column / Measure Name |
Report Column / Measure Origin |
|---|---|
|
Audience Count |
Marketing Campaign (F_MKT_CMPGN_S) Fact |
|
Applicant Count |
Marketing Campaign (F_MKT_CMPGN_S) Fact |
|
Admit Count |
Marketing Campaign (F_MKT_CMPGN_S) Fact |
|
Confirm Count |
Marketing Campaign (F_MKT_CMPGN_S) Fact |
|
Enroll Count |
Marketing Campaign (F_MKT_CMPGN_S) Fact |
|
Applied Rate |
(Students Applied / Audience Count) * 100 |
|
Admit Rate |
(Students Admitted / Audience Count) * 100 |
|
Confirmed Rate |
(Students Confirmed / Audience Count) * 100 |
|
Enrollment Rate |
(Students Enrolled / Audience Count) * 100 |
|
Actual Cost |
The fact table has unit cost populated by ETL and is summarized by the report. |
|
Cost per Enrolled Student |
Actual Cost / Enroll Count |