Retention Campaign Effectiveness Page
Use the Retention Campaign Effectiveness page to enable you to analyze the effectiveness of retention campaigns executed during a given term.
Image: Retention Campaign Effectiveness dashboard
This example illustrates the fields and controls on the Retention Campaign Effectiveness dashboard. You can find definitions for the fields and controls later on this page.
|
Usage |
Reports |
Dashboard Prompt |
|---|---|---|
|
Enables you to analyze the effectiveness of retention campaigns executed during a given term. You can compare like campaigns to identify which campaigns helped in retaining more at-risk students and which were more cost effective and gave better return on investment. |
This page includes the following two reports:
|
Use the Recruiting and Admissions - Retention Campaign Effectiveness page prompt to filter page results by:
|
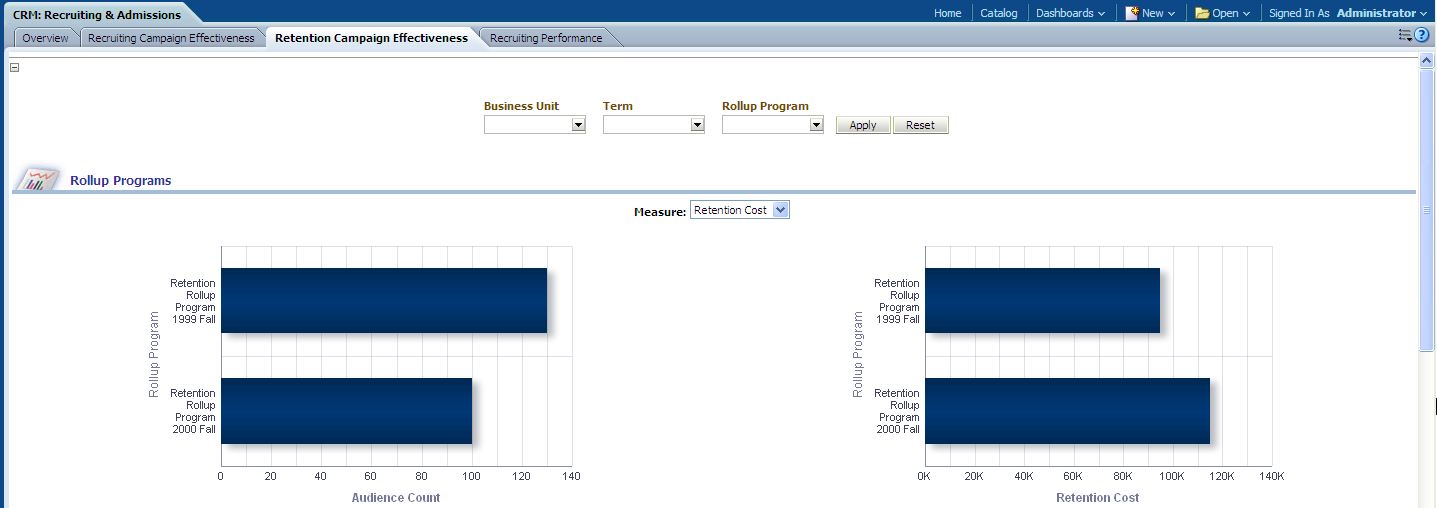
Rollup Programs Report
Use the Rollup Programs report, which helps analyze the effectiveness of retention campaigns executed during a given term.
Image: Rollup Programs report, part 1
This example illustrates the fields and controls on the Rollup Programs report, part 1. You can find definitions for the fields and controls later on this page.
![CRM_RollupPrograms[Retention]Report1](img/i-4642ab0fn-7dc9.png)
Image: Rollup Programs report, part 2
This example illustrates the fields and controls on the Rollup Programs report, part 2. You can find definitions for the fields and controls later on this page.
![CRM_RollupPrograms[Retention]Report2](img/i-4642ab0fn-7e8c.png)
You can compare like campaigns to identify which campaigns helped in retaining more at-risk students and which were more cost effective and gave better return on investment. You can also filter report results on Business Unit, Term, and Rollup Program meant for retention. You can select the rollup programs to be compared.
|
X,Y Axis Data for Bar Chart 1 |
X,Y Axis Data for Bar Chart 2 |
Measure Filter |
|---|---|---|
|
The first Recruiting Programs graph displays Audience Count data on the x-axis, and Rollup Program data on the y-axis. |
The second graph displays Retention Rate data on the x-axis and Rollup Program data on the y-axis. The x-axis can also display Retention Cost, depending on your Measure filter selection. |
Use this filter to view report results by the following measures:
|
|
Report Column / Measure Name |
Report Column / Measure Origin |
|---|---|
|
Audience Count |
Marketing Campaign (F_MKT_CMPGN_S) Fact |
|
Retention Count |
Marketing Campaign (F_MKT_CMPGN_S) Fact |
|
Retention Rate |
(Retention Count/Audience Count) * 100 |
|
Retention Cost |
The fact table has unit cost populated by ETL and is summarized by the report. |
|
Cost per Retained Student |
Retention Cost / Retention Count |
Retention Programs Report
Use the Retention Programs report, which enables you to analyze retention programs.
Note: You can also drill down from the Rollup Programs section to a specific rollup to compare programs associated to that rollup. When you drill down, the Retention Programs page is displayed. You can view the same report in the second section of the Retention Campaign Effectiveness page, where you can select the program type and the programs to be compared.
Image: Retention Programs report, part 1
This example illustrates the fields and controls on the Retention Programs report, part 1. You can find definitions for the fields and controls later on this page.
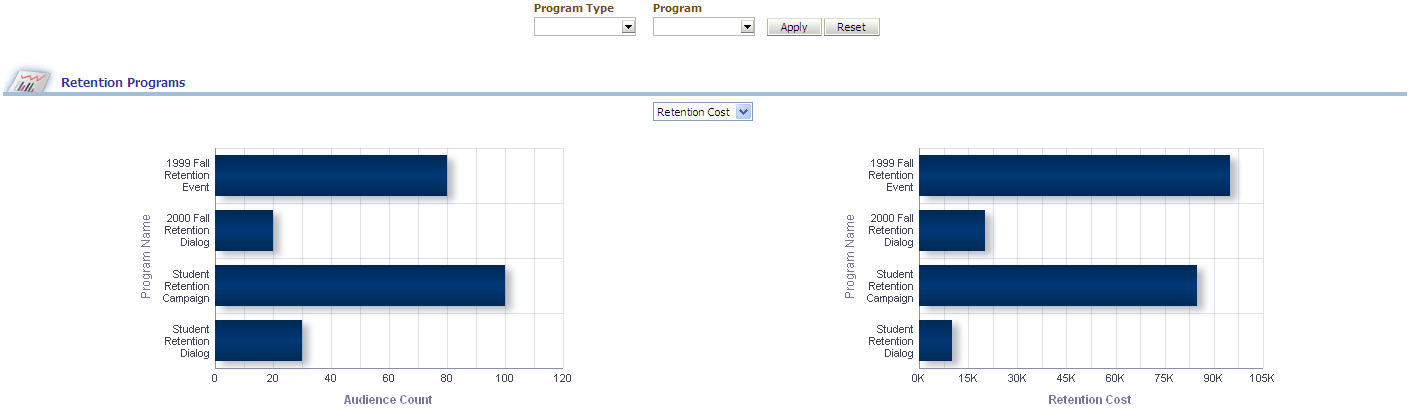
Image: Retention Programs report, part 2
This example illustrates the fields and controls on the Retention Programs report, part 2. You can find definitions for the fields and controls later on this page.
|
X,Y Axis Data for Bar Chart 1 |
X,Y Axis Data for Bar Chart 2 |
|---|---|
|
The first Retention Programs graph displays Audience Count on the x-axis, and Program Name on the y-axis. |
The second graph displays Retention Cost data on the x-axis and Program Name data on the y-axis. The x-axis can also display Retention Rate, depending on your Measure filter selection. |
|
Program Type Filter |
Program Filter |
Measure Filter |
|---|---|---|
|
Use this filter to view report results by the following program types:
|
Use this filter to view report results by the specific program. Available choices are filtered by your choice of Program Type. |
Use this filter to view report results by the following measures:
|
|
Report Column / Measure Name |
Report Column / Measure Origin |
|---|---|
|
Audience Count |
Marketing Campaign (F_MKT_CMPGN_S) Fact |
|
Retained Student Count |
Marketing Campaign (F_MKT_CMPGN_S) Fact |
|
Retention Rate |
(Retention Count/Audience Count) * 100 |
|
Retention Cost |
The fact table has unit cost populated by ETL and is summarized by the report. |
|
Cost per Retained Student |
Retention Cost / Retention Count |