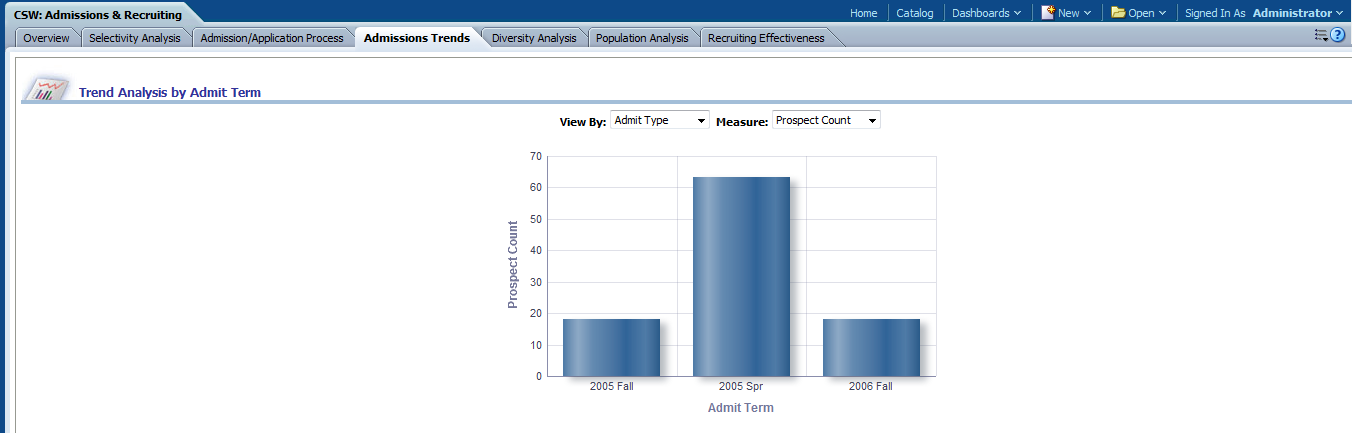
Admissions Trend Page
Use the Admissions Trend page to provide you with a birds eye view of student applicants and related information, such as academic career and residency .
Image: Admissions Trend page
Admissions Trend page
|
Usage |
Reports |
|---|---|
|
Provides you with a birds eye view of student applicants and related information, such as academic career and residency. |
This page is comprised of the following reports:
|
Trend Analysis By Admit Term Report
Access the Trend Analysis By Admit Term report, which enables you to evaluate which academic programs students are inquiring about by admit term.
Image: Trend Analysis By Admit Term report, part 1
Trend Analysis By Admit Term report, part 1.
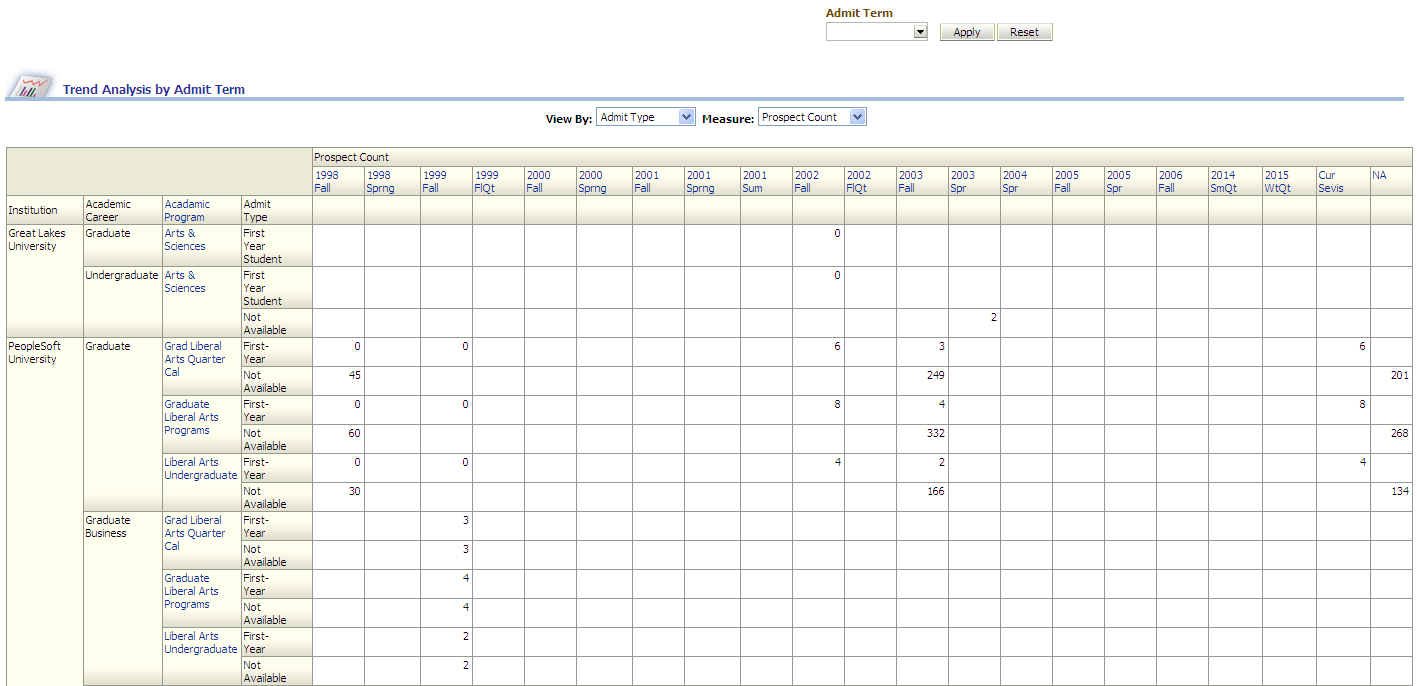
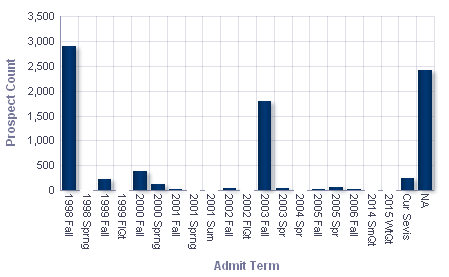
Image: Trend Analysis By Admit Term report, part 2
Trend Analysis By Admit Term report, part 2.
|
X,Y Axis Data |
View By |
Measure |
|---|---|---|
|
The Trend Analysis By Admit Term bar chart displays Admit Term data on the x-axis and Prospect Count data on the y-axis. The x-axis can also display Academic Level data, depending on your View By filter selection. The y-axis can also display any of the following measures, depending on your Measure filter selection:
|
Use this filter to refine report results by:
|
Use this filter to refine the report results by:
|
|
Report Column / Measure Name |
Report Column / Measure Origin |
|---|---|
|
Academic Career |
Academic Career (D_ACAD_CAR) Dimension |
|
Academic Level |
Academic Level (D_ACAD_LVL) Dimension |
|
Academic Program |
Academic Program (D_ACAD_PROG) Dimension |
|
Admit Academic Year |
Admit Term (D_TERM) Dimension |
|
Admit Term |
Admit Term (D_TERM) Dimension |
|
Admit Type |
Admit Type (D_ADMIT_TYPE) Dimension |
|
Institution |
Institution (D_INSTITUTION) Dimension |
|
Admit Count |
Admission Funnel (F_ADM_FUNNEL) Fact |
|
Applicant Count |
Admission Funnel (F_ADM_FUNNEL) Fact |
|
Confirm Count |
Admission Funnel (F_ADM_FUNNEL) Fact |
|
Enrollment Count |
Admission Funnel (F_ADM_FUNNEL) Fact |
|
Prospect Count |
Admission Funnel (F_ADM_FUNNEL) Fact |
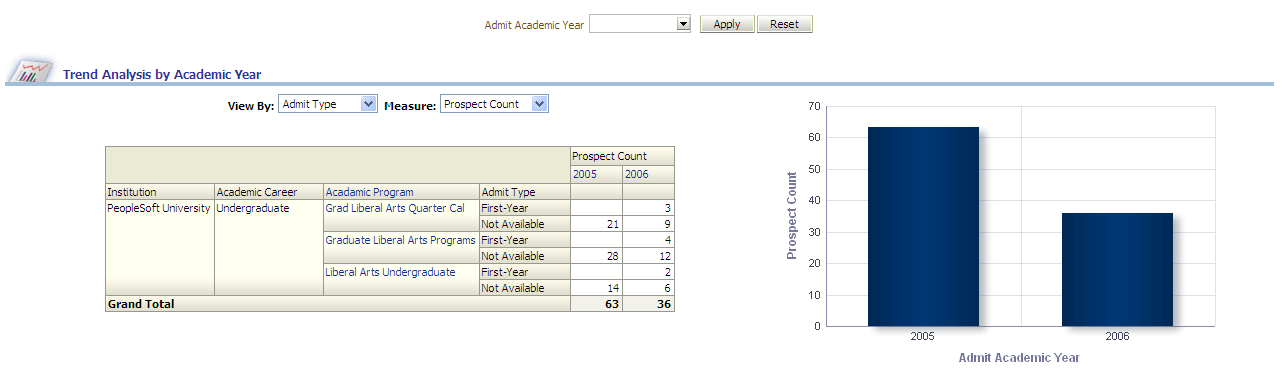
Trend Analysis By Academic Year Report
Access the Trend Analysis By Academic Year report, which enables you to evaluate which academic programs students are inquiring about by academic year.
Image: Trend Analysis By Academic Year report
Trend Analysis By Academic Year report
|
X,Y Axis Data |
Top Level Report Filters |
|---|---|
|
The Trend Analysis By Academic Year graph displays Admit Academic Year data on the x-axis and Prospect Count data on the y-axis. The y-axis can also display any of the following measures, depending on your Measure filter selection:
|
Use this top level report filters to refine the report results by:
|
|
View By Filter |
Measure Filter |
|---|---|
|
Use this filter to view table report results by:
|
Use this filter to view report results by the following measures:
|
|
Report Column / Measure Name |
Report Column / Measure Origin |
|---|---|
|
Academic Career |
Academic Career (D_ACAD_CAR) Dimension |
|
Academic Level |
Academic Level (D_ACAD_LVL) Dimension |
|
Academic Program |
Academic Program (D_ACAD_PROG) Dimension |
|
Admit Academic Year |
Admit Term (D_TERM) Dimension |
|
Admit Type |
Admit Type (D_ADMIT_TYPE) Dimension |
|
Institution |
Institution (D_INSTITUTION) Dimension |
|
Admit Count |
Admission Funnel (F_ADM_FUNNEL) Fact |
|
Applicant Count |
Admission Funnel (F_ADM_FUNNEL) Fact |
|
Confirm Count |
Admission Funnel (F_ADM_FUNNEL) Fact |
|
Enrollment Count |
Admission Funnel (F_ADM_FUNNEL) Fact |
|
Prospect Count |
Admission Funnel (F_ADM_FUNNEL) Fact |
Applicant Trends - Admissions and Recruiting Report
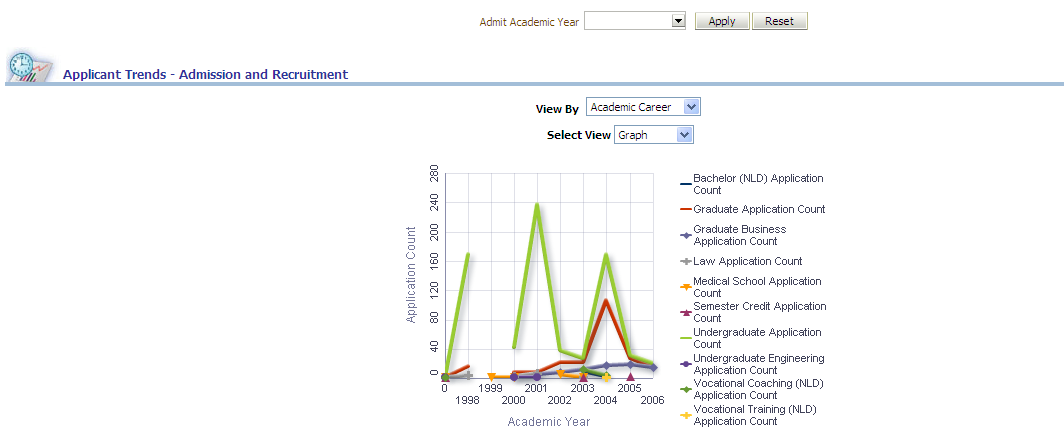
Access the Applicant Trends - Admissions and Recruiting report, which enables you to evaluate the total number of applicants applying by year, academic career, academic program, residency, and so forth.
Image: Applicant Trends report
Applicant Trends - Admissions and Recruiting report.
|
X,Y Axis Data |
View By Filter |
Select View Filter |
|---|---|---|
|
The Applicant Trends - Admission and Recruitment graph displays Academic Year data on the x-axis and Application Count by Academic Career data on the y-axis. You can also group the y-axis application count value by any of the following dimensions, depending on your selection in the second View By filter:
Note: You can click on graph data to review drill down data. |
Use this filter to view report results by:
|
Use this filter to:
|
|
Report Column / Measure Name |
Report Column / Measure Origin |
|---|---|
|
Academic Career |
Academic Career (D_ACAD_CAR) Dimension |
|
Academic Level |
Academic Level (D_ACAD_LVL) Dimension |
|
Academic Program |
Academic Program (D_ACAD_PROG) Dimension |
|
Admit Academic Year |
Admit Term (D_TERM) Dimension |
|
Admit Type |
Admit Type (D_ADMIT_TYPE) Dimension |
|
Applicant Ethnic Group |
Person (D_PERSON) Dimension |
|
Applicant Gender Code |
Person (D_PERSON) Dimension |
|
Campus |
Campus (D_CAMPUS) Dimension |
|
Citizenship Country |
Person Attribute (D_PERSON_ATTR) Dimension |
|
Institution |
Institution (D_INSTITUTION) Dimension |
|
Residency |
Residency (D_RSDNCY) Dimension |
|
Applicant Count |
Admission Funnel (F_ADM_FUNNEL) Fact |
|
% of Academic Year Total |
(Applicant Count / Total Number of Applicants) * 100 Note: Applicant Count and Total Number of Applicants are constrained by a specific academic year. |
Applicant Trends Report
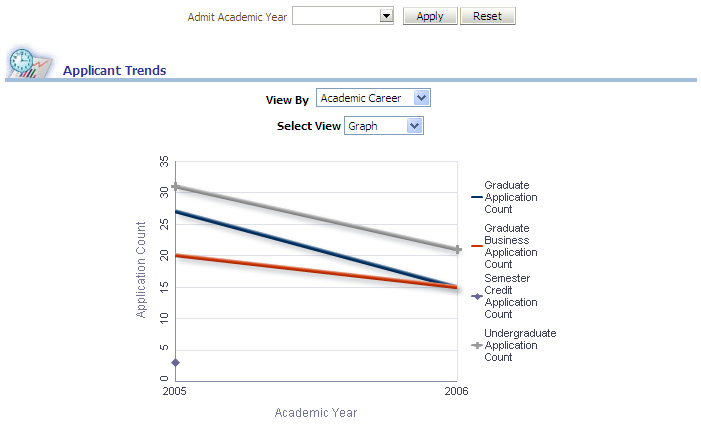
Use the Applicant Trends report, which enables you to review applicant count trends by academic year.
Image: Applicant Trends report
This example illustrates the fields and controls on the Applicant Trends report. You can find definitions for the fields and controls later on this page.
|
X,Y Axis Data |
Admit Academic Year Filter |
|---|---|
|
The Applicant Trends graph displays Academic Year data on the x-axis and Application Count by Academic Career data on the y-axis. You can also group the y-axis application count value by any of the following dimensions, depending on your selection in the second View By filter:
Note: You can click on graph data to review drill down data. |
Use this filter to refine the report results to a specific academic year. |
|
View By Filter |
Select View Filter |
|---|---|
|
Use this filter to view report results by:
|
Use this filter to:
|