Admissions Page
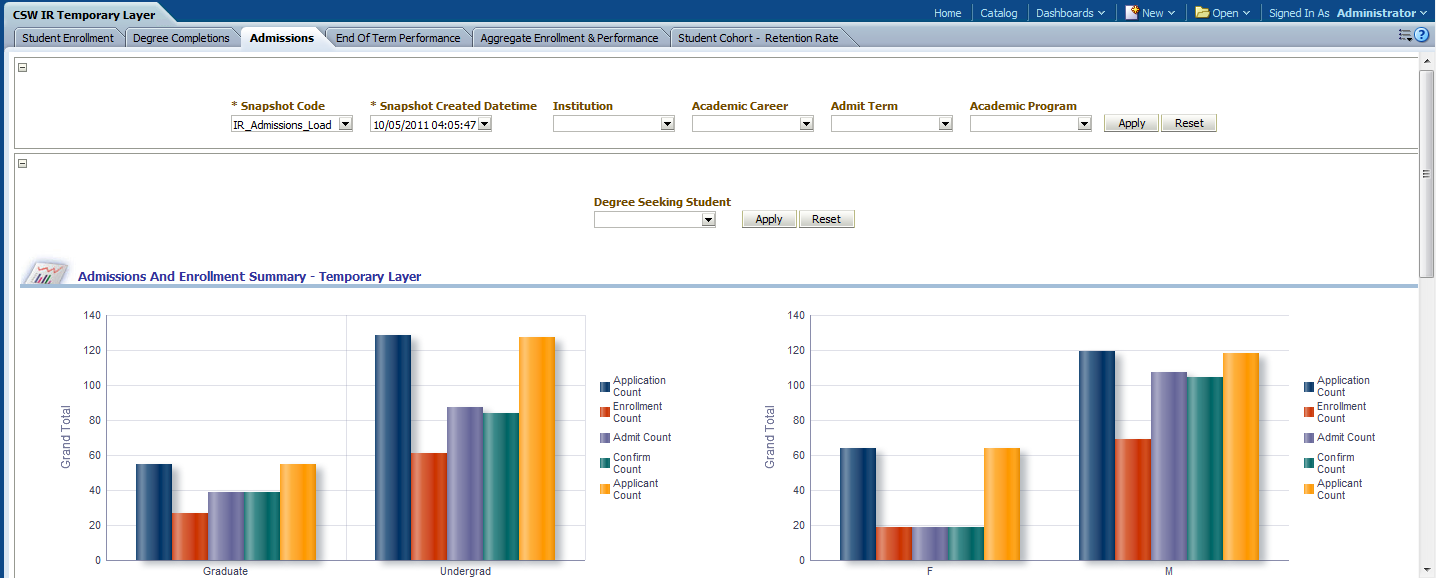
Use the Admissions (temporary layer) page to obtain an overview of student admissions and enrollment.
Note: Since the reports and report fields for the temporary layer are identical to those in the frozen layer, documentation is provided for the temporary layer only.
Image: Admissions (temporary layer) page
Admissions (temporary layer) page
|
Usage |
Reports |
Dashboard Prompt |
|---|---|---|
|
Provides you with an overview of student admissions and enrollment. |
This page is comprised of the following reports:
|
Use the Admissions page prompts to filter page results by:
|
Admissions and Enrollment Summary Report
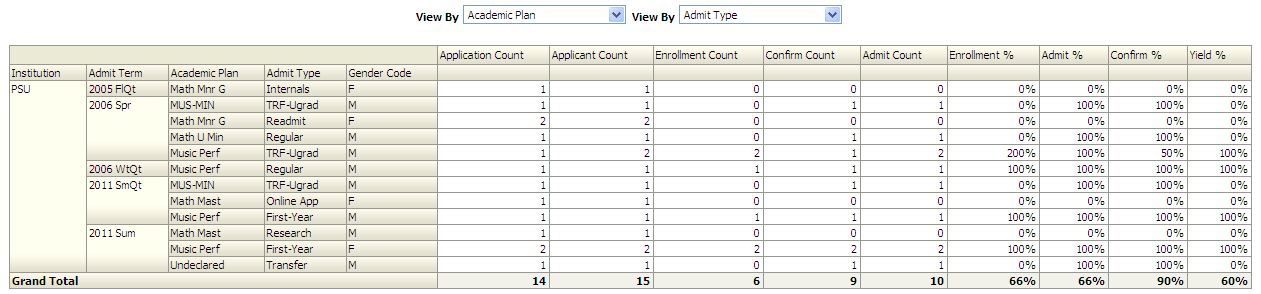
Access the Admissions and Enrollment Summary report, which enables you to analyze student admission and enrollment by ethnicity, gender, academic program, and so forth.
Image: Admissions and Enrollment Summary (temporary) report, part 1
Admissions and Enrollment Summary report, part 1
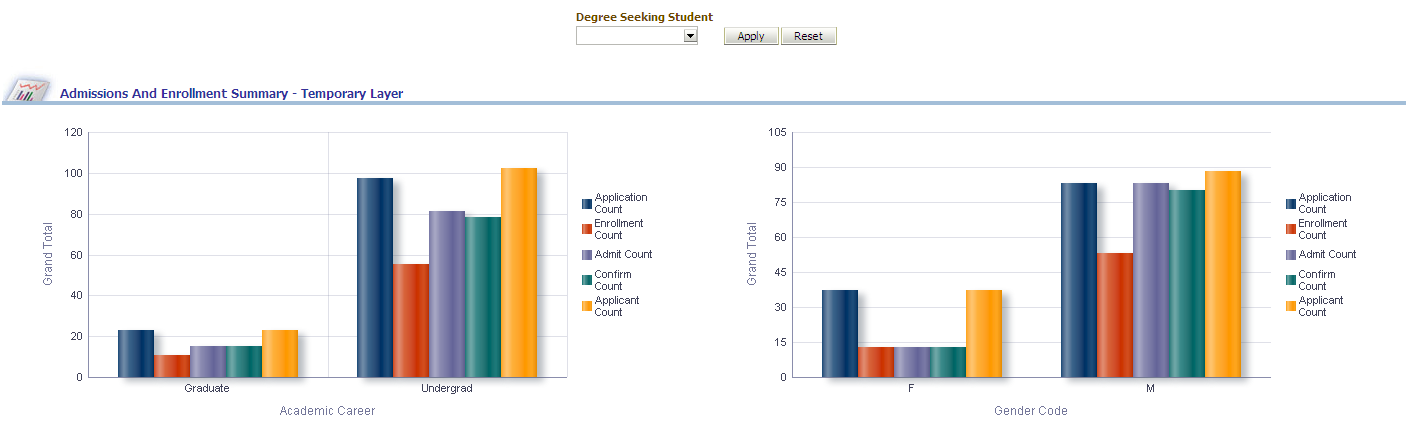
Image: Admissions and Enrollment Summary (temporary) report, part 2
Admissions and Enrollment Summary report, part 2
|
X,Y Axis Data Left Graph |
X,Y Axis Data Right Graph |
Degree Seeking Student Filter |
|---|---|---|
|
This graph displays academic career data on the x-axis and application count, enrollment count, admit count, confirm count, and applicant count totals on the y-axis. |
This graph displays gender data on the x-axis and application count, enrollment count, admit count, confirm count, and applicant count totals on the y-axis. |
Use this filter to narrow results of the Admissions and Enrollment Summary report to degree seeking or non degree seeking students. You can select Y (yes) or N (no). |
|
View by Filter (Left) |
View by Filter (Right) |
|---|---|
|
Use this filter to view the pivot table results by:
|
Use this filter to view the pivot table results by:
|
The following table lists the columns and measures used in the Admissions and Enrollment Summary report.
|
Report Column / Measure Name |
Report Column / Measure Origin |
|---|---|
|
Academic Load |
Academic Load (PS_TD_ACAD_LOAD) Dimension |
|
Academic Career |
Academic Career (PS_TD_ACAD_CAR) Dimension |
|
Academic Program |
Academic Program (PS_TD_ACAD_PROG) Dimension |
|
Academic Plan |
Academic Plan (PS_TD_ACAD_PLAN) Dimension |
|
Application Center |
Application Center (PS_TD_APPL_CNTR) Dimension |
|
Ethnic Group |
Person Attribute (PS_TD_PERSON_ATTR) Dimension |
|
Last school attended |
Last School Attended (PS_TD_EXT_ORG) Dimension |
|
Official Residence |
Person Attribute (PS_TD_PERSON_ATTR) Dimension |
|
Academic Level |
Academic Level (PS_TD_ACAD_LVL) Dimension |
|
Gender |
Person (PS_TD_PERSON) Dimension |
|
Degree Seeking Student (DEG_CERT_SEEK_FLG) |
Admission Application (PS_TF_ADM_APPL) Fact |
|
Application Count |
Admission Application (PS_TF_ADM_APPL) Fact |
|
Enrollment Count |
Admission Application (PS_TF_ADM_APPL) Fact |
|
Admit Count |
Admission Application (PS_TF_ADM_APPL) Fact |
|
Confirm Count |
Admission Application (PS_TF_ADM_APPL) Fact |
|
Applicant Count |
Admission Application (PS_TF_ADM_APPL) Fact |
Trend Analysis by Admit Term and Test Scores Submitted (SAT/ACT) Report
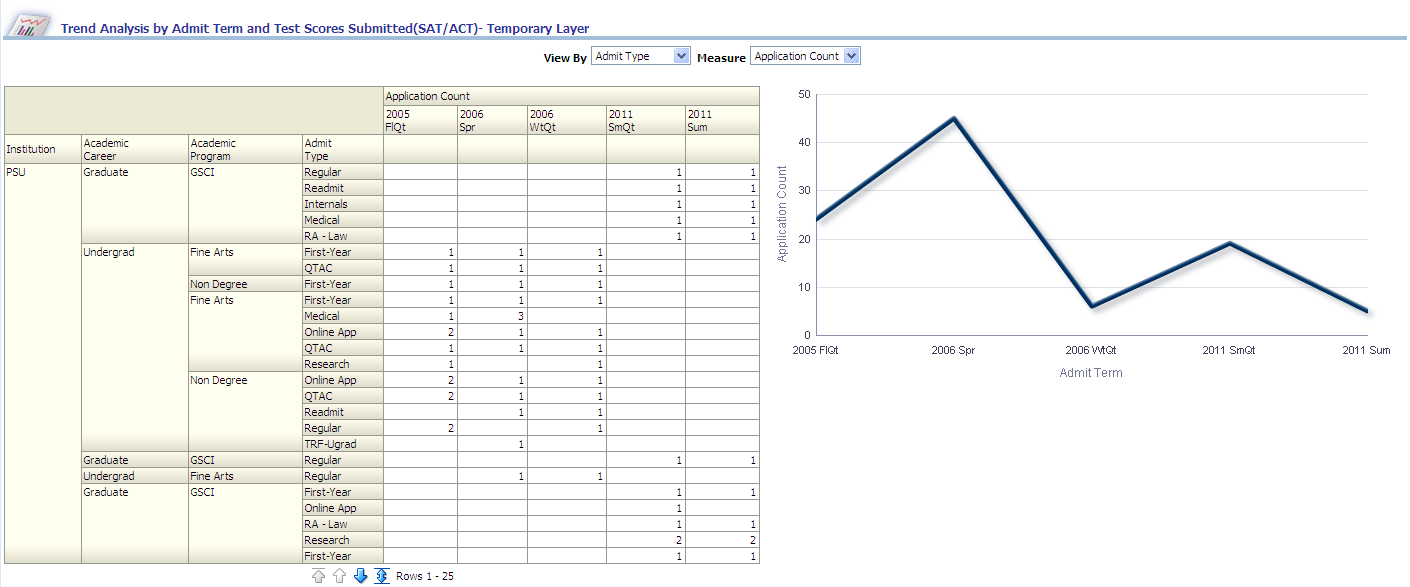
Access the Trend Analysis by Admit Term and Test Scores Submitted SAT/ACT report, which facilitates trend analysis by comparing admit term with application count, applicant count, enrolled count, confirmed count, or admitted count, and SAT/ACT test scores.
Image: Trend Analysis by Admit Term and Test Scores Submitted SAT/ACT (temporary) report
Trend Analysis by Admit Term and Test Scores Submitted SAT/ACT report
|
X,Y Axis Data |
View By Filter |
Measure Filter |
|---|---|---|
|
This graph displays admit term data on the x-axis and applicant count data on the y-axis. The y-axis can also display any of the following measures, depending on your Measure filter selection:
|
Use this filter to view pivot table results by:
|
Use this filter to view report results by the following measures:
|
The following table lists the columns and measures used in the Trend Analysis by Admit Term and Test Scores Submitted SAT/ACT report.
|
Report Column / Measure Name |
Report Column / Measure Origin |
|---|---|
|
Admit Type |
Admit Type (PS_TD_ADMIT_TYPE) Dimension |
|
Academic Level |
Academic Level (PS_TD_ACAD_LVL) Dimension |
|
Institution |
Institution (D_INSTITUTION) Dimension |
|
Application Count |
Admission Application (PS_TF_ADM_APPL) Fact |
|
Applicant Count |
Admission Application (PS_TF_ADM_APPL) Fact |
|
Enrollment Count |
Admission Application (PS_TF_ADM_APPL) Fact |
|
Confirm Count |
Admission Application (PS_TF_ADM_APPL) Fact |
|
Admit Count |
Admission Application (PS_TF_ADM_APPL) Fact |
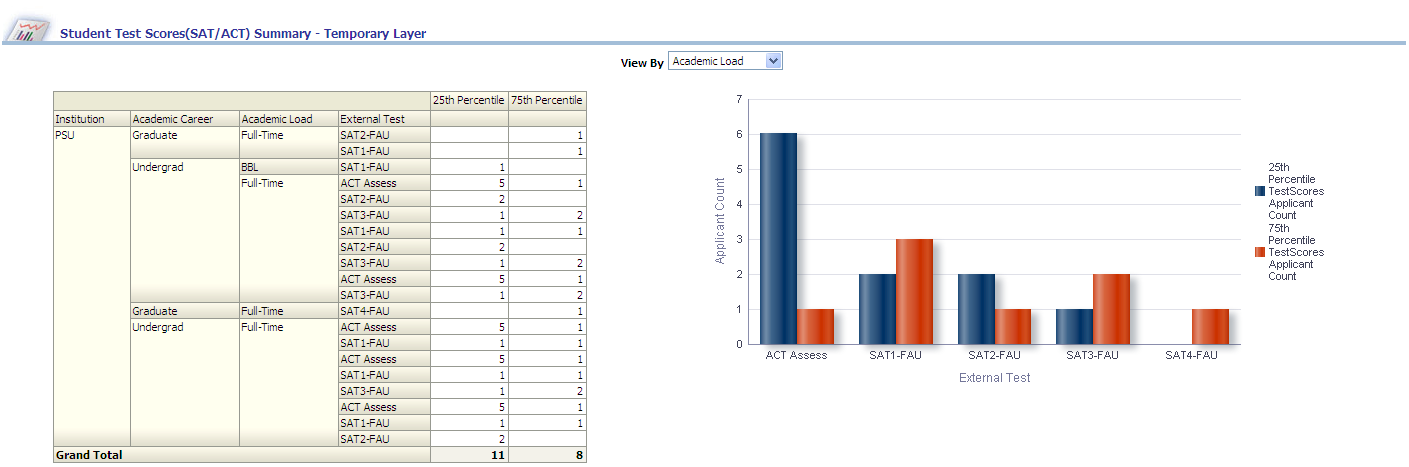
Student Test Scores (SAT/ACT) Summary Report
Access the Student Test Scores (SAT/ACT) Summary report, which enables you to analyze student test scores by academic career, admit type, and so forth.
Image: Student Test Scores (SAT/ACT) Summary (temporary) report
Student Test Scores (SAT/ACT) Summary report
|
X,Y Axis Data |
View by Filter |
|---|---|
|
This graph displays external test (ACT, SAT1, and so forth) and percentile data on the x-axis, and applicant count data by percentile on the y-axis. |
Use this filter to view the pivot table results by:
|
The following table lists the columns and measures used in the Student Test Scores (SAT/ACT) Summary report.
|
Report Column / Measure Name |
Report Column / Measure Origin |
|---|---|
|
Academic Load |
Academic Load (PS_TD_ACAD_LOAD) Dimension |
|
Admit Type |
Admit Type (PS_TD_ADMIT_TYPE) Dimension |
|
Academic Level |
Academic Level (PS_TD_ACAD_LVL) Dimension |
|
Campus |
Campus (PS_TD_CAMPUS) Dimension |
|
Application Center |
Application Center (PS_TD_APPL_CNTR) Dimension |
|
External Test |
External Test Component ( PS_TD_EX_TST_CMPNT) Dimension |
|
Applicant Count |
Student Test Scores (PS_TF_STU_TSTSCORE) Fact |
|
Percentile |
Score Percentile columns are located in the Student Test Scores (PS_TF_STU_TSTSCORE) Fact. Case When "Enterprise Warehouse"."Fact Student Admissions (Temporary Layer)"."Score Percentile" <= 25 Then '25th Percentile' Else '75th Percentile' End |
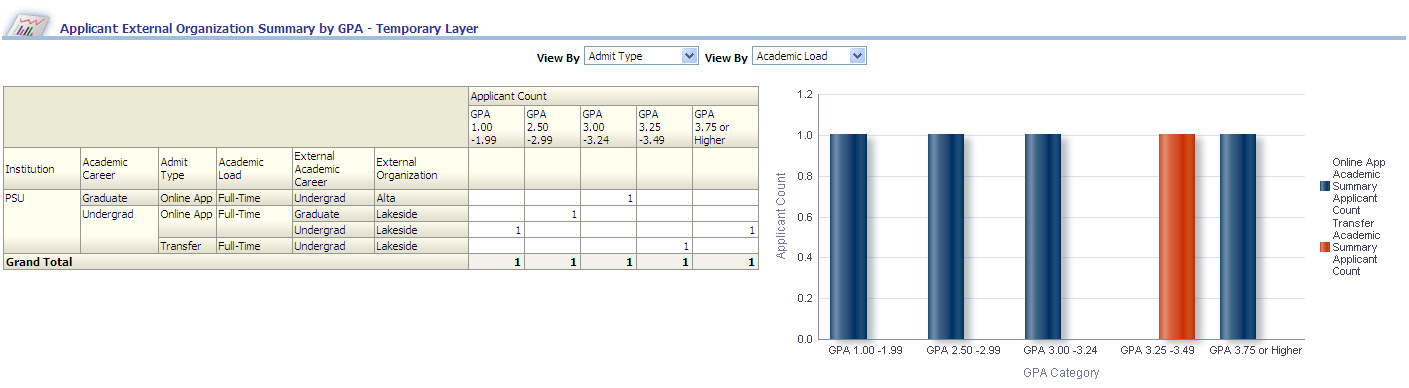
Applicant External Organization Summary by GPA Report
Access the Applicant External Organization Summary by GPA report, which enables you to analyze applicant external GPA by academic career, external organization, and so forth.
This report displays only the students for whom you collected external GPA information.
Image: Applicant External Organization Summary by GPA (temporary) report
Applicant External Organization Summary by GPA report
|
X,Y Axis Data |
View by Filter (Left) |
View by Filter (Right) |
|---|---|---|
|
This graph displays GPA category data on the x-axis and applicant count data by admit type and academic load on the y-axis. The y-axis can also plot any of the following dimensions, depending on the second (right) View By filter selection:
|
Use this filter to view pivot table and graph results by:
|
Use this filter to view the pivot table results by:
|
The following table lists the columns and measures used in the Applicant External Organization Summary by GPA report.
|
Report Column / Measure Name |
Report Column / Measure Origin |
|---|---|
|
Admit Type |
Admit Type (PS_TD_ADMIT_TYPE) Dimension |
|
Academic Level |
Academic Level (PS_TD_ACAD_LVL) Dimension |
|
Campus |
Campus (PS_TD_CAMPUS) Dimension |
|
Application Center |
Application Center (PS_TD_APPL_CNTR) Dimension |
|
Academic Program |
Academic Program (PS_TD_ACAD_PROG) Dimension |
|
Academic Load |
Academic Load (PS_TD_ACAD_LOAD) Dimension |
|
External Organization |
External Organization (PS_TD_EXT_ORG) Dimension |
|
External Academic Career |
Academic Career (PS_TD_ACAD_CAR) Dimension |
|
GPA Category |
External Academic Summary (PS_TF_EXT_ACAD_SUM) Fact |
|
Applicant Count |
External Academic Summary (PS_TF_EXT_ACAD_SUM) Fact |