Aggregate Enrollment and Performance Page
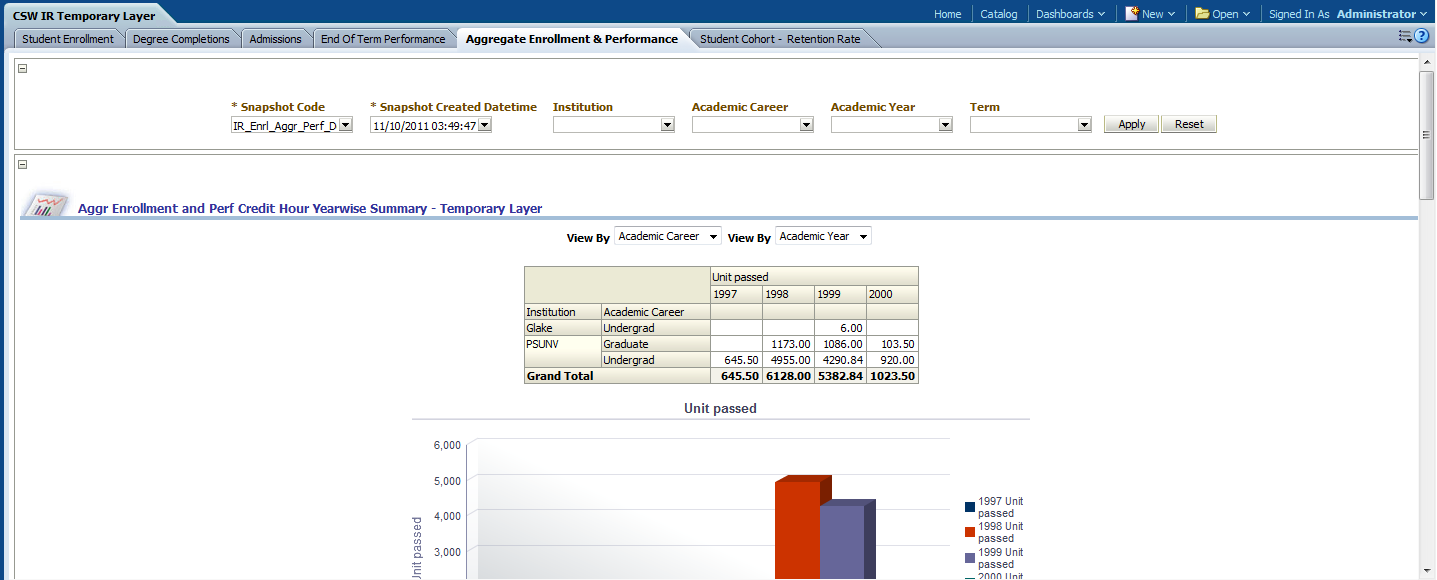
Use the Aggregate Enrollment and Performance page to obtain an overview of student credit hours and full time equivalency (including full time equivalency by enrollment), which enables you to measure student completion of coursework and educational attainment.
Image: Aggregate Enrollment and Performance page
Aggregate Enrollment and Performance page
|
Usage |
Reports |
Dashboard Prompt |
|---|---|---|
|
Provides you with an overview of student credit hours and full time equivalency (including full time equivalency by enrollment), which enables you to measure student completion of coursework and educational attainment. |
This page is comprised of the following reports:
|
Use the Aggregate Enrollment and Performance page prompts to filter page results by:
|
Aggregate Enrollment and Performance Credit Hour Yearwise Summary Report
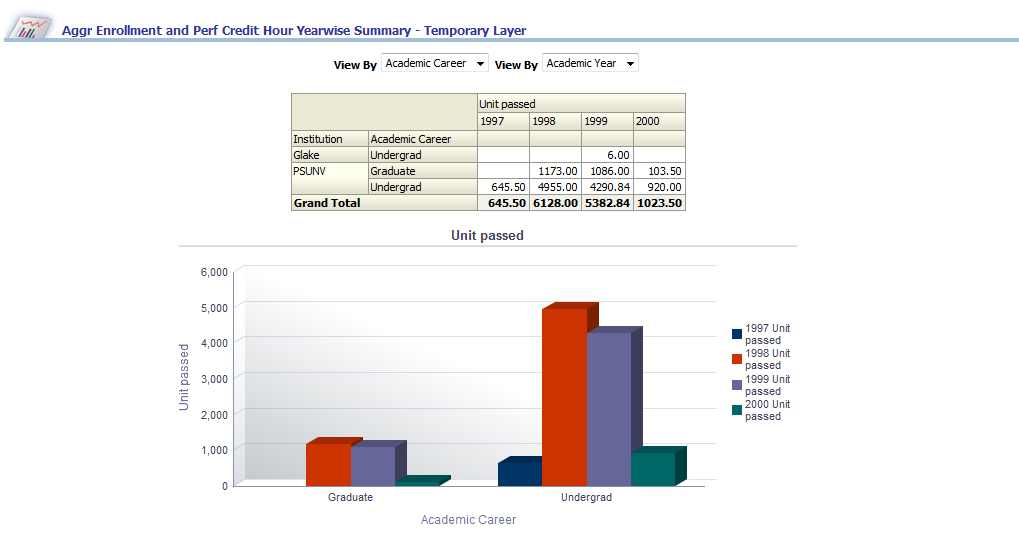
Access the Aggregate Enrollment and Performance Credit Hour Yearwise Summary report, which enables you to analyze aggregated student credit hours by institution, academic year, academic level, and so forth.
Image: Aggregate Enrollment and Performance Credit Hour Yearwise Summary report
Aggregate Enrollment and Performance Credit Hour Yearwise Summary report
|
X,Y Axis Graph Data |
View By Filter (Left) |
View By Filter (Right) |
|---|---|---|
|
The Aggregate Enrollment and Performance Credit Hour Yearwise Summary graph displays academic career and academic year data on the x-axis and unit passed data on the y-axis. The x-axis can also plot any of the following dimensions, depending on either of the two View By filter selections:
|
Use this filter to view the Aggregate Enrollment and Performance Credit Hour Yearwise Summary report results by:
|
Use this filter to view the Aggregate Enrollment and Performance Credit Hour Yearwise Summary report results by academic year. |
The following table lists the columns and measures used in the Aggregate Enrollment and Performance Credit Hour Yearwise Summary report.
|
Report Column / Measure Name |
Report Column / Measure Origin |
|---|---|
|
Academic Career |
Academic Career (PS_TD_ACAD_CAR) Dimension |
|
Academic Level |
Academic Level (PS_TD_ACAD_LVL) Dimension |
|
Academic Load |
Academic Load (PS_TD_ACAD_LOAD) Dimension |
|
Academic Year |
Year (PS_TD_YEAR) Dimension |
|
Admit Type |
Admit Type (PS_TD_ADMIT_TYPE) Dimension |
|
Institution |
Institution (D_INSTITUTION) Dimension |
|
Unit Passed |
Aggregate Enrollment (PS_TF_STU_ENRL_AGGR) Fact |
Aggregate Enrollment and Performance Full Time Equivalent (FTE) Yearwise Summary Report
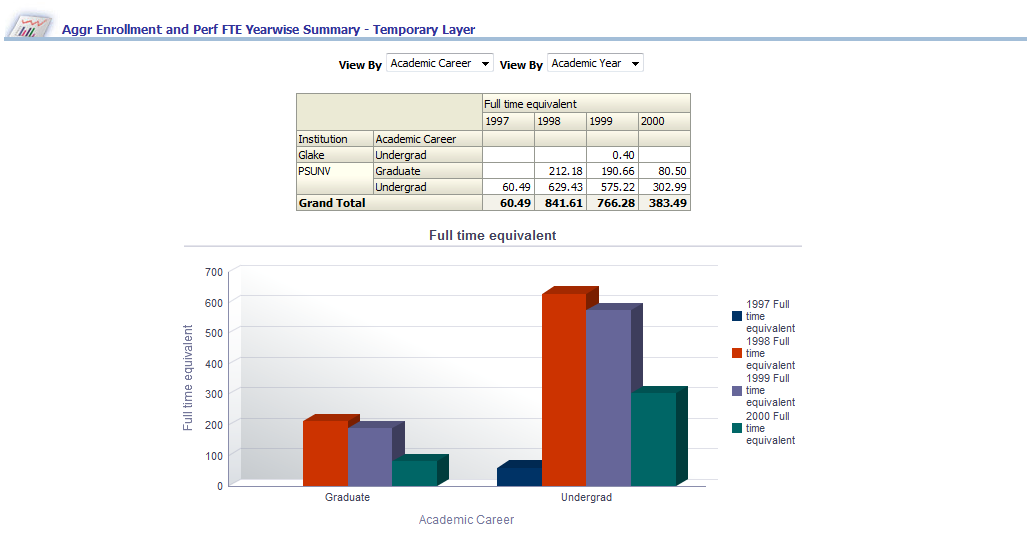
Access the Aggregate Enrollment and Performance FTE Yearwise Summary report, which enables you to analyze aggregated full time equivalency data by institution, academic year, academic level, and so forth.
Image: Aggregate Enrollment and Performance FTE Yearwise Summary report
Aggregate Enrollment and Performance FTE Yearwise Summary report
|
X,Y Axis Graph Data |
View By Filter (Left) |
View By Filter (Right) |
|---|---|---|
|
The Aggregate Enrollment and Performance FTE Yearwise Summary graph displays academic career and academic year data on the x-axis and full time equivalent (FTE) data on the y-axis. The x-axis can also plot any of the following dimensions, depending on either of the two View By filter selections:
|
Use this filter to view the Aggregate Enrollment and Performance FTE Yearwise Summary report results by:
|
Use this filter to view the Aggregate Enrollment and Performance FTE Yearwise Summary report results by Academic Year. |
The following table lists the columns and measures used in the Aggregate Enrollment and Performance FTE Yearwise Summary report.
|
Report Column / Measure Name |
Report Column / Measure Origin |
|---|---|
|
Academic Career |
Academic Career (PS_TD_ACAD_CAR) Dimension |
|
Academic Level |
Academic Level (PS_TD_ACAD_LVL) Dimension |
|
Academic Load |
Academic Load (PS_TD_ACAD_LOAD) Dimension |
|
Academic Year |
Year (PS_TD_YEAR) Dimension |
|
Admit Type |
Admit Type (PS_TD_ADMIT_TYPE) Dimension |
|
Institution |
Institution (D_INSTITUTION) Dimension |
|
Full Time Equivalent |
End of Term Performance Aggregate (PS_TF_STU_ENRL_AGGR) Fact |
Aggregate Enrollment and Performance Full Time Equivalent (FTE) Summary Report
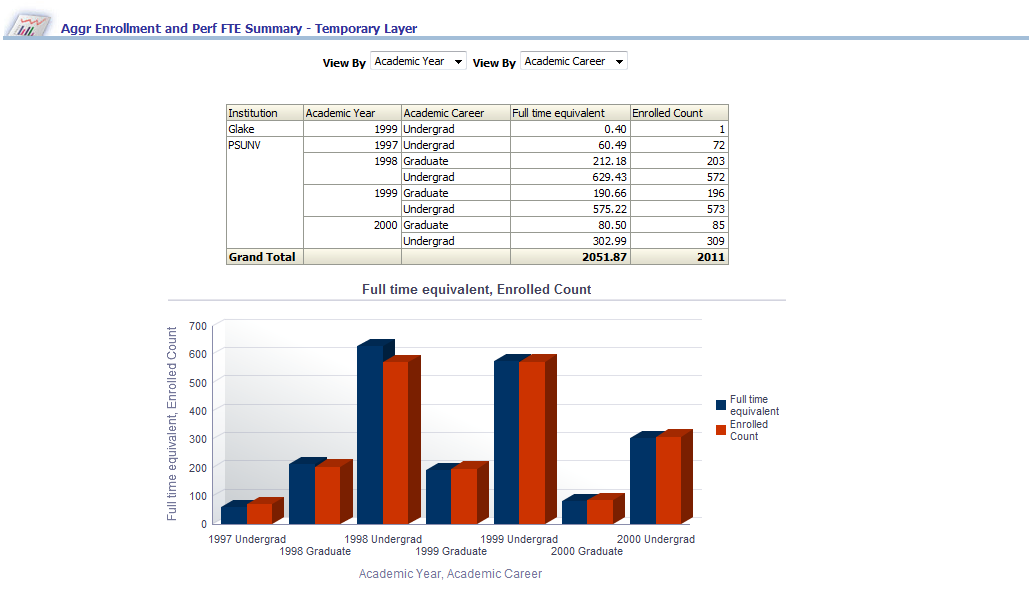
Access the Aggregate Enrollment and Performance FTE Summary report, which enables you to analyze aggregated enrollment and full time equivalency data by institution, academic year, academic level, and so forth.
Image: Aggregate Enrollment and Performance FTE Summary report
Aggregate Enrollment and Performance FTE Summary report
|
X,Y Axis Graph Data |
View By Filter (Left) |
View By Filter (Right) |
|---|---|---|
|
The Aggregate Enrollment and Performance FTE Summary graph displays academic year and academic career data on the x-axis, and full time equivalent (FTE) and enrolled count data on the y-axis. The x-axis can also plot any of the following dimensions, depending on either of the two View By filter selections:
|
Use this filter to view the Aggregate Enrollment and Performance FTE Summary report results by Academic Year. |
Use this filter to view the Aggregate Enrollment and Performance FTE Yearwise Summary report results by:
|
The following table lists the columns and measures used in the Aggregate Enrollment and Performance FTE Summary report.
|
Report Column / Measure Name |
Report Column / Measure Origin |
|---|---|
|
Academic Career |
Academic Career (PS_TD_ACAD_CAR) Dimension |
|
Academic Level |
Academic Level (PS_TD_ACAD_LVL) Dimension |
|
Academic Load |
Academic Load (PS_TD_ACAD_LOAD) Dimension |
|
Academic Year |
Year (PS_TD_YEAR) Dimension |
|
Admit Type |
Admit Type (PS_TD_ADMIT_TYPE) Dimension |
|
Institution |
Institution (D_INSTITUTION) Dimension |
|
Enrolled Count |
Student Enrollment (PS_TF_STDNT_ENRL) Fact |
|
Full Time Equivalent |
End of Term Performance Aggregate (PS_TF_STU_ENRL_AGGR) Fact |