Degree Completions Page
Use the Degree Completions (temporary layer) page to obtain an overview of degree completions by primary and secondary majors, student athletes, and award trends.
Note: Since the reports and report fields for the temporary layer are identical to those in the frozen layer, documentation is provided for the temporary layer only.
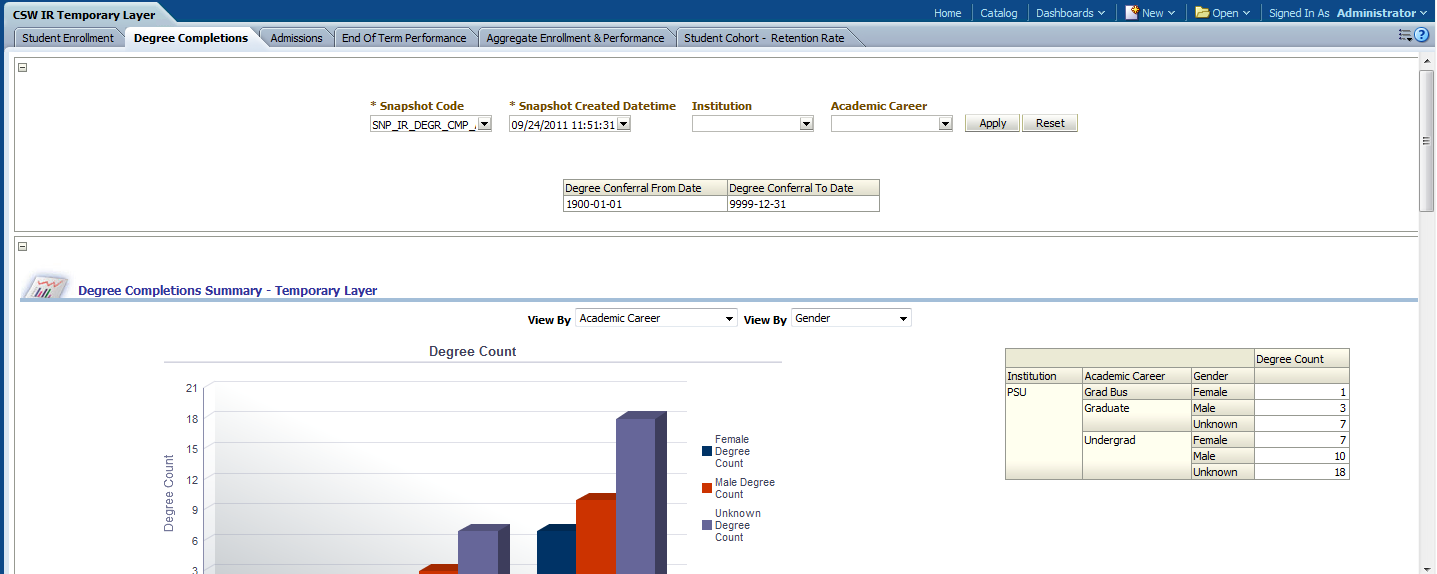
Image: Degree Completions (temporary layer) page
Degree Completions (temporary layer) page
|
Usage |
Reports |
Dashboard Prompt |
|---|---|---|
|
Provides you with an overview of degree completions by primary and secondary majors, student athletes, and award trends. |
This page is comprised of the following reports:
|
Use the Degree Completions page prompts to filter page results by:
|
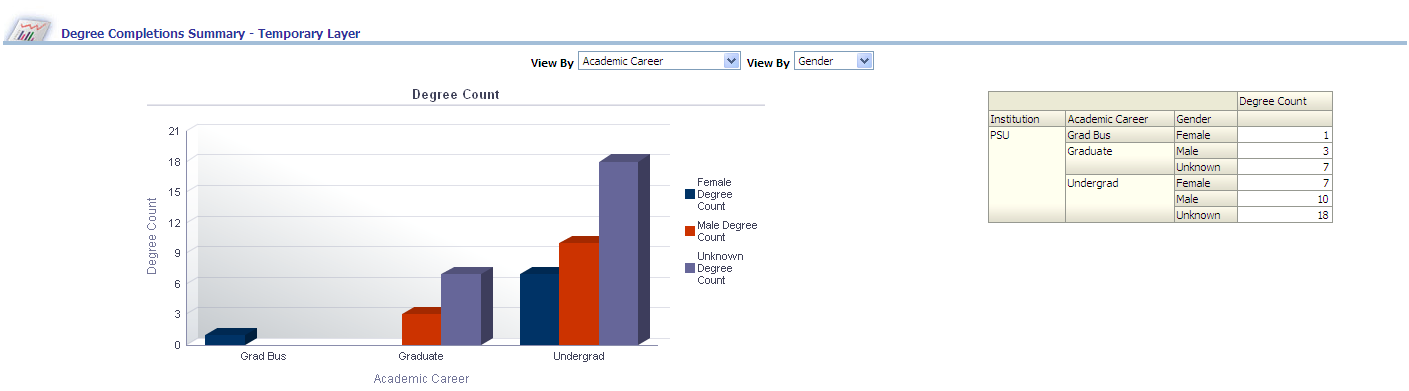
Degree Completions Summary Report
Access the Degree Completions Summary report, which enables you to analyze student degree completions by academic plan, degree, age range, gender, ethnicity, and so forth.
Image: Degree Completions Summary (temporary) report
Degree Completions Summary report
|
X,Y Axis Data |
View By Filter (Left) |
View By Filter (Right) |
|---|---|---|
|
The Degree Count Summary graph displays academic career and gender data on the x-axis and degree count data on the y-axis. The x-axis can also plot any of the following dimensions, depending on either of the two View By filter selections:
|
Use this filter to view the Degree Completions Summary report results by:
|
Use this filter to view the Degree Completions Summary report results by:
|
The following table lists the columns and measures used in the Degree Completions Summary report.
|
Report Column / Measure Name |
Report Column / Measure Origin |
|---|---|
|
Academic Career |
Academic Career (PS_TD_ACAD_CAR) Dimension |
|
Academic Plan |
Academic Plan (PS_TD_ACAD_PLAN) Dimension |
|
Academic Load |
Academic Load (PS_TD_ACAD_LOAD) Dimension |
|
Admit Type |
Admit Type (PS_TD_ADMIT_TYPE) Dimension |
|
Campus |
Campus (PS_TD_CAMPUS) Dimension |
|
Degree |
Degree (PS_TD_DEG) Dimension |
|
Degree Status |
Degree Status (PS_TD_DEG_STAT) Dimension |
|
Ethnicity |
Person Attribute (PS_TD_PERSON_ATTR) Dimension |
|
Institution |
Institution (D_INSTITUTION) Dimension |
|
Last School Attended |
Last School Attended (PS_TD_EXT_ORG) Dimension |
|
Age Range |
Person (PS_TD_PERSON) Dimension |
|
Gender |
Person (PS_TD_PERSON) Dimension |
|
Degree Count |
Completions (PS_TF_DEG_COMPLTN) Fact |
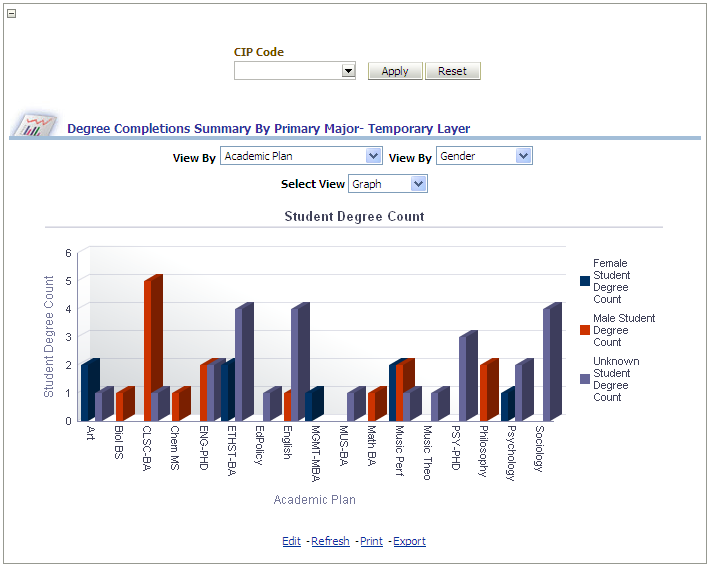
Degree Completions Summary By Primary Major Report
Access the Degree Completions Summary By Primary Major report, which enables you to analyze student degree completions by primary major, academic plan, degree, and so forth.
Image: Degree Completions Summary By Primary Major (temporary) report
Degree Completions Summary By Primary Major report
|
X,Y Axis Data |
CIP (Classification of Instructional Programs) Code |
|---|---|
|
The Degree Completions Summary By Primary Major graph displays academic plan and gender data on the x-axis and student degree count data on the y-axis. The x-axis can also plot any of the following dimensions, depending on either of the two View By filter selections:
|
Use this filter to narrow results of the Degree Completions Summary By Primary Major report by the Classification of Instructional Programs. You can select multiple CID codes. |
|
View by Filter (Left) |
View by Filter (Right) |
Select View |
|---|---|---|
|
Use this filter to view the Degree Completions Summary By Primary Major report results by:
|
Use this filter to view the Degree Completions Summary By Primary Major report results by:
|
Use this filter to:
|
The following table lists the columns and measures used in the Degree Completions Summary By Primary Major report.
|
Report Column / Measure Name |
Report Column / Measure Origin |
|---|---|
|
CIP Code (CIP_LD) |
Academic Plan (PS_TD_ACAD_PLAN) Dimension |
|
Academic Plan |
Academic Plan (PS_TD_ACAD_PLAN) Dimension |
|
Academic Load |
Academic Load (PS_TD_ACAD_LOAD) Dimension |
|
Admit Type |
Admit Type (PS_TD_ADMIT_TYPE) Dimension |
|
Campus |
Campus (PS_TD_CAMPUS) Dimension |
|
Degree |
Degree (PS_TD_DEG) Dimension |
|
Last School Attended |
Last School Attended (PS_TD_EXT_ORG) Dimension |
|
Gender |
Person (PS_TD_PERSON) Dimension |
|
Age Range |
Person (PS_TD_PERSON) Dimension |
|
Ethnicity |
Person Attribute (PS_TD_PERSON_ATTR) Dimension |
|
Student Group |
Student Group (PS_TD_STDNT_GRP) Dimension |
|
Degree Status |
Degree Status (PS_TD_DEG_STAT) Dimension |
|
Degree Count |
Completions (PS_TF_DEG_COMPLTN) Fact |
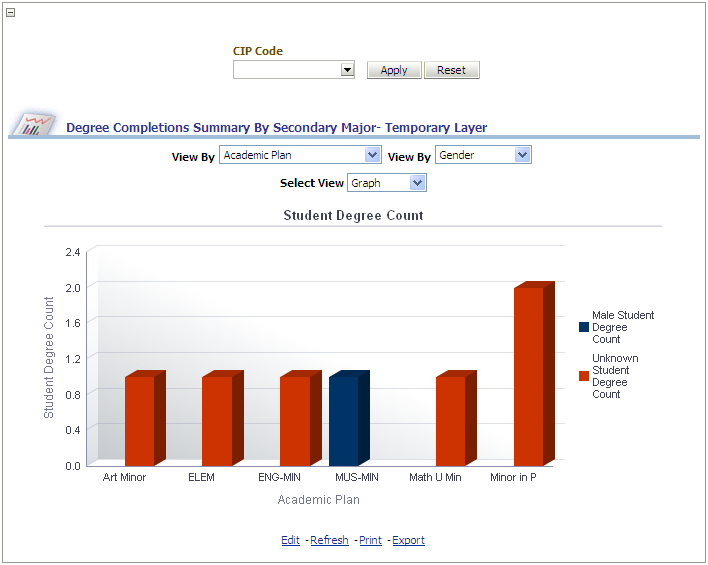
Degree Completions Summary By Secondary Major Report
Access the Degree Completions Summary By Secondary Major report, which enables you to analyze student degree completions by secondary major and academic plan, degree, and so forth.
Image: Degree Completions Summary By Secondary Major (temporary) report
Degree Completions Summary By Secondary Major report
|
X,Y Axis Data |
CIP (Classification of Instructional Programs) Code |
|---|---|
|
The Degree Completions Summary By Secondary Major graph displays academic plan and gender data on the x-axis and student degree count data on the y-axis. The x-axis can also plot any of the following dimensions, depending on either of the two View By filter selections:
|
Use this filter to narrow results of the Degree Completions Summary By Secondary Major report by the Classification of Instructional Programs. You can select multiple CID codes. |
|
View by Filter (Left) |
View by Filter (Right) |
Select View |
|---|---|---|
|
Use this filter to view the Degree Completions Summary By Secondary Major report results by:
|
Use this filter to view the Degree Completions Summary By Secondary Major report results by:
|
Use this filter to:
|
The following table lists the columns and measures used in the Degree Completions Summary By Secondary Major report.
|
Report Column / Measure Name |
Report Column / Measure Origin |
|---|---|
|
CIP Code (CIP_LD) |
Academic Plan (PS_TD_ACAD_PLAN) Dimension |
|
Academic Plan |
Academic Plan (PS_TD_ACAD_PLAN) Dimension |
|
Academic Load |
Academic Load (PS_TD_ACAD_LOAD) Dimension |
|
Admit Type |
Admit Type (PS_TD_ADMIT_TYPE) Dimension |
|
Campus |
Campus (PS_TD_CAMPUS) Dimension |
|
Degree |
Degree (PS_TD_DEG) Dimension |
|
Last School Attended |
Last School Attended (PS_TD_EXT_ORG) Dimension |
|
Gender |
Person (PS_TD_PERSON) Dimension |
|
Age Range |
Person (PS_TD_PERSON) Dimension |
|
Ethnicity |
Person Attribute (PS_TD_PERSON_ATTR) Dimension |
|
Student Group |
Student Group (PS_TD_STDNT_GRP) Dimension |
|
Degree Status |
Degree Status (PS_TD_DEG_STAT) Dimension |
|
Degree Count |
Completions (PS_TF_DEG_COMPLTN) Fact |
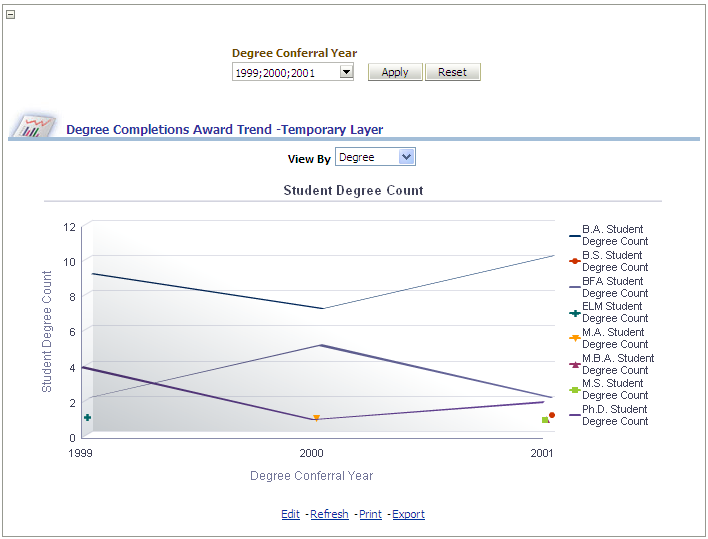
Degree Completions Award Trend Report
Access the Degree Completions Award Trend report, which enables you to analyze degree completion trends by gender, degree type, and so forth.
Image: Degree Completions Award Trend (temporary) report
Degree Completions Award Trend report
|
X,Y Axis Data |
Degree Conferral Year |
View by Filter |
|---|---|---|
|
The Degree Completions Award Trend graph displays degree conferral year data on the x-axis and student degree count data by degree type on the y-axis, with degree (type) plotted across the x-y axis. The graph can also plot any of the following dimensions across the x-y axis, depending on your View By filter selection:
|
Use this filter to narrow results of the Degree Completions Award Trend report to specific degree conferral years. You can select multiple conferral years. |
Use this filter to view the Degree Completions Award Trend report results by:
|
The following table lists the columns and measures used in the Degree Completions Award Trend report.
|
Report Column / Measure Name |
Report Column / Measure Origin |
|---|---|
|
Admit Type |
Admit Type (PS_TD_ADMIT_TYPE) Dimension |
|
Campus |
Campus (PS_TD_CAMPUS) Dimension |
|
Degree |
Degree (PS_TD_DEG) Dimension |
|
Gender |
Person (PS_TD_PERSON) Dimension |
|
Degree Conferral Year (YEAR_NUM) |
Day (PS_D_DAY) Dimension |
|
Degree Count |
Completions (PS_TF_DEG_COMPLTN) Fact |
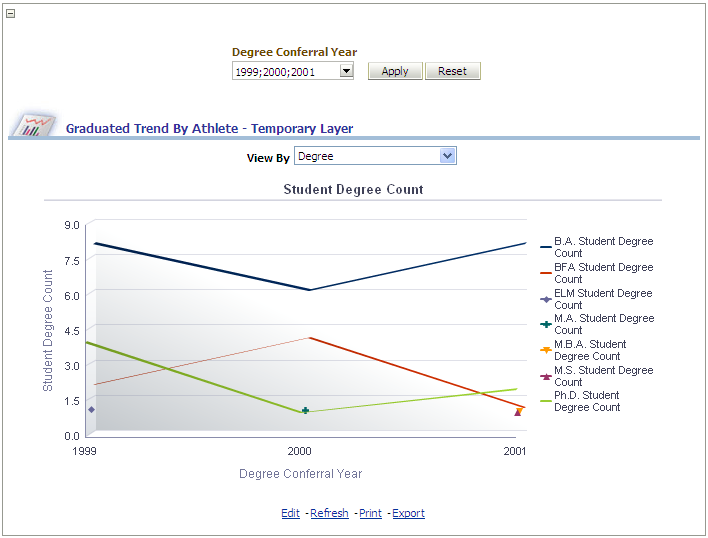
Graduated Trend By Athlete Report
Access the Graduated Trend By Athlete report, which enables you to analyze degree completion trends for student athletes by ethnicity, gender, degree type, and so forth.
Image: Graduated Trend By Athlete (temporary) report
Graduated Trend By Athlete report
|
X,Y Axis Data |
Degree Conferral Year |
View by Filter |
|---|---|---|
|
The Graduated Trend By Athlete graph displays degree conferral year data on the x-axis and student degree count data by degree type on the y-axis, with degree (type) plotted across the x-y axis. The graph can also plot any of the following dimensions across the x-y axis, depending on your View By filter selection:
|
Use this filter to narrow results of the Graduated Trend By Athlete report to specific degree conferral years. You can select multiple conferral years. |
Use this filter to view the Graduated Trend By Athlete report results by:
|
The following table lists the columns and measures used in the Graduated Trend By Athlete report.
|
Report Column / Measure Name |
Report Column / Measure Origin |
|---|---|
|
Degree |
Degree (PS_TD_DEG) Dimension |
|
Academic Load |
Academic Load (PS_TD_ACAD_LOAD) Dimension |
|
Admit Type |
Admit Type (PS_TD_ADMIT_TYPE) Dimension |
|
Campus |
Campus (PS_TD_CAMPUS) Dimension |
|
Last school attended |
Last School Attended (PS_TD_EXT_ORG) Dimension |
|
Age Range |
Person (PS_TD_PERSON) Dimension |
|
Gender |
Person (PS_TD_PERSON) Dimension |
|
Ethnicity |
Person Attribute (PS_TD_PERSON_ATTR) Dimension |
|
Student Group |
Student Group (PS_TD_STDNT_GRP) Dimension |
|
Degree Conferral Year (YEAR_NUM) |
Day (PS_D_DAY) Dimension |
|
Degree Count |
Completions (PS_TF_DEG_COMPLTN) Fact |