End of Term Performance Page
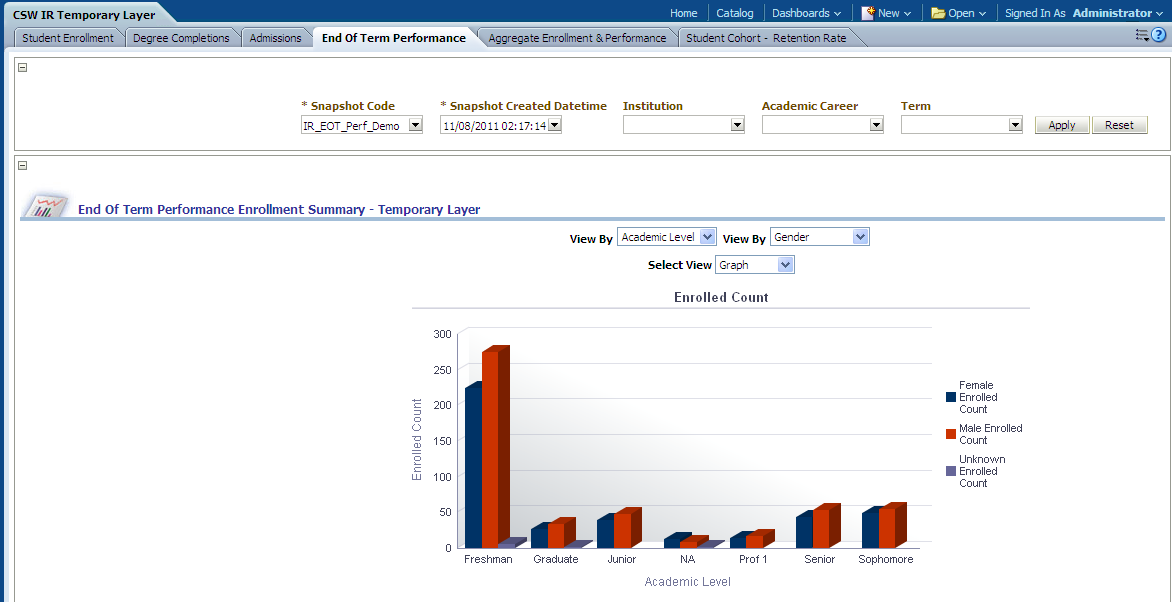
Use the End of Term Performance page to obtain an overview of end of term enrollment trends.
Image: End of Term Performance page
End of Term Performance page
|
Usage |
Reports |
Dashboard Prompt |
|---|---|---|
|
Provides you with an overview of end of term enrollment trends. |
This page is comprised of the following reports:
|
Use the End of Term Performance page prompts to filter page results by:
|
End of Term Performance Enrollment Summary Report
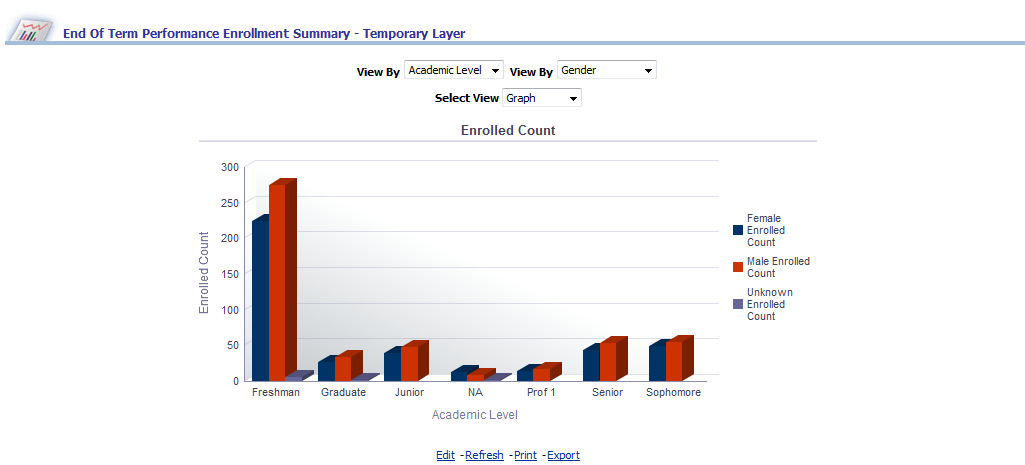
Access the End of Term Performance Enrollment Summary report, which enables you to analyze summarized end of term enrollment by gender, ethnicity, academic level, and so forth.
Image: End of Term Performance Enrollment Summary report
End of Term Performance Enrollment Summary report
|
X,Y Axis Graph Data |
View By Filter (Left) |
View By Filter (Right) |
Select View |
|---|---|---|---|
|
The End of Term Performance Enrollment Summary graph displays academic level and gender data on the x-axis and enrolled count data on the yaxis. The x-axis can also plot any of the following dimensions, depending on either of the two View By filter selections:
|
Use this filter to view the End of Term Performance Enrollment Summary report results by:
|
Use this filter to view the End of Term Performance Enrollment Summary report results by:
|
Use this filter to:
|
The following table lists the columns and measures used in the End of Term Performance Enrollment Summary report.
|
Report Column / Measure Name |
Report Column / Measure Origin |
|---|---|
|
Academic Level |
Academic Level (PS_TD_ACAD_LVL) Dimension |
|
Academic Load |
Academic Load (PS_TD_ACAD_LOAD) Dimension |
|
Admit Type |
Admit Type (PS_TD_ADMIT_TYPE) Dimension |
|
Ethnicity |
Person Attribute (PS_TD_PERSON_ATTR) Dimension |
|
Gender |
Person (PS_TD_PERSON) Dimension |
|
Enrolled Count |
Student Enrollment (PS_TF_STDNT_ENRL) Fact |
End Of Term Performance Enrollment Detail Report
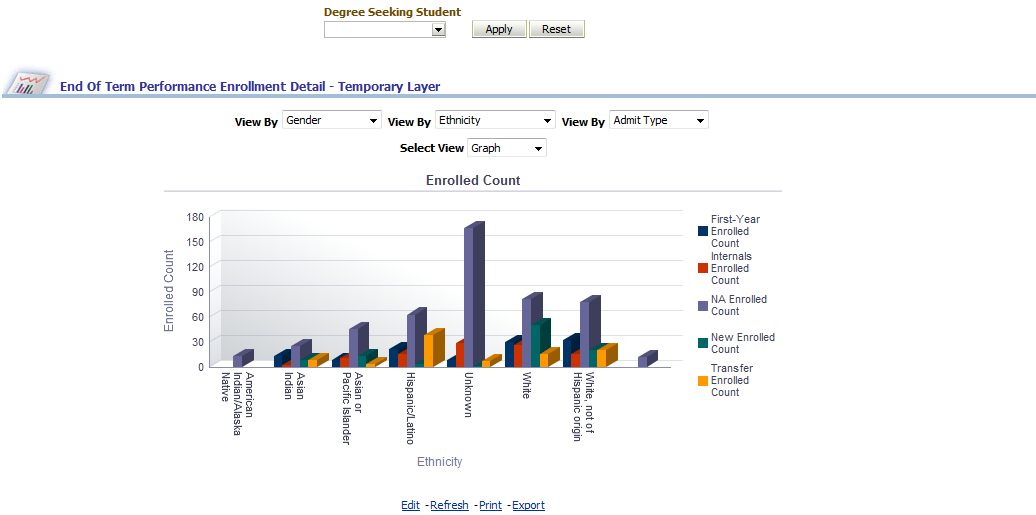
Access the End of Term Performance Enrollment Detail report, which enables you to analyze detailed end of term enrollment by gender, ethnicity, age range, academic level, and so forth.
Image: End of Term Performance Enrollment Detail report
End of Term Performance Enrollment Detail report
|
X,Y Axis Graph Data |
Degree Seeking Student Filter |
|---|---|
|
The End of Term Performance Enrollment Detail graph displays gender, ethnicity, and admit type data on the x-axis and enrolled count data on the y-axis. The x-axis can also plot any of the following dimensions, depending on the View By filter selections:
|
Use this filter to view the End of Term Performance Enrollment Detail report results by degree seeking or non degree seeking students. |
|
View By Filter (Left) |
View By Filter (Middle) |
View By Filter (Right) |
Select View |
|---|---|---|---|
|
Use this filter to view the End of Term Performance Enrollment Detail report results by:
Note: This filter affects only pivot view results. |
Use this filter to view the End of Term Performance Enrollment Detail report results by:
|
Use this filter to view the End of Term Performance Enrollment Detail report results by:
|
Use this filter to:
|
The following table lists the columns and measures used in the End Of Term Performance Enrollment Detail report.
|
Report Column / Measure Name |
Report Column / Measure Origin |
|---|---|
|
Academic Level |
Academic Level (PS_TD_ACAD_LVL) Dimension |
|
Academic Load |
Academic Load (PS_TD_ACAD_LOAD) Dimension |
|
Admit Type |
Admit Type (PS_TD_ADMIT_TYPE) Dimension |
|
Age Range |
Person (PS_TD_PERSON) Dimension |
|
Ethnicity |
Person Attribute (PS_TD_PERSON_ATTR) Dimension |
|
Gender |
Person (PS_TD_PERSON) Dimension |
|
Official Residence |
Person Attribute (PS_TD_PERSON_ATTR) Dimension |
|
Enrolled Count |
Student Enrollment (PS_TF_STDNT_ENRL) Fact |
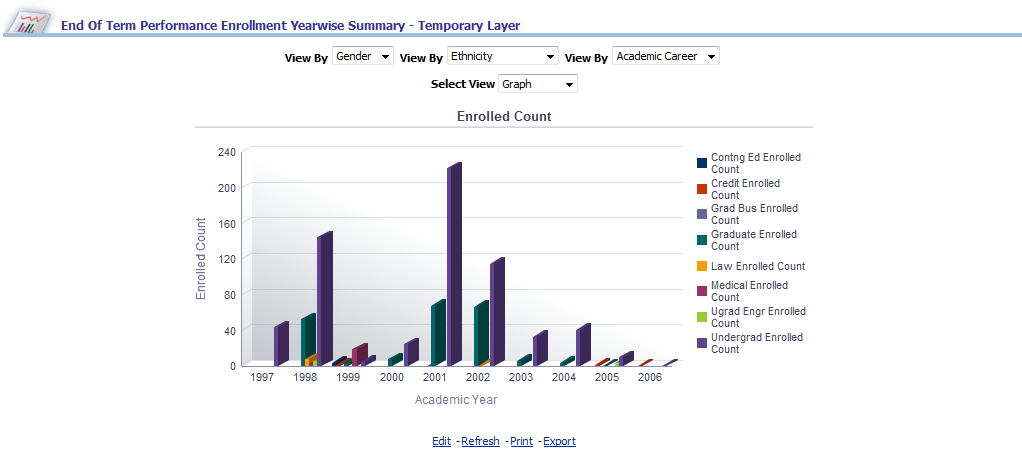
End Of Term Performance Enrollment Yearwise Summary Report
Access the End of Term Performance Enrollment Yearwise Summary report, which enables you to analyze
summarized end of term enrollment by academic year, ethnicity, academic level, and so forth.
Image: End of Term Performance Enrollment Yearwise Summary report
End of Term Performance Enrollment Yearwise Summary report
|
X,Y Axis Graph Data |
|---|
|
The End of Term Performance Enrollment Yearwise Summary graph displays ethnicity, and academic career data on the x-axis and enrolled count data on the y-axis. Gender data is also displayed when in pivot table format. The x-axis can also plot any of the following dimensions, depending on the View By filter selections:
|
|
View By Filter (Left) |
View By Filter (Middle) |
View By Filter (Right) |
Select View |
|---|---|---|---|
|
Use this filter to view the End of Term Performance Enrollment Yearwise Summary report results by Gender. Note: This filter affects only pivot view results. |
Use this filter to view the End of Term Performance Enrollment Yearwise Summary report results by:
|
Use this filter to view the End of Term Performance Enrollment Yearwise Summary report results by:
|
Use this filter to:
|
The following table lists the columns and measures used in the End Of Term Performance Enrollment Yearwise Summary report.
|
Report Column / Measure Name |
Report Column / Measure Origin |
|---|---|
|
Academic Career |
Academic Career (PS_TD_ACAD_CAR) Dimension |
|
Academic Level |
Academic Level (PS_TD_ACAD_LVL) Dimension |
|
Academic Load |
Academic Load (PS_TD_ACAD_LOAD) Dimension |
|
Admit Type |
Admit Type (PS_TD_ADMIT_TYPE) Dimension |
|
Ethnicity |
Person Attribute (PS_TD_PERSON_ATTR) Dimension |
|
Gender |
Person (PS_TD_PERSON) Dimension |
|
Official Residence |
Person Attribute (PS_TD_PERSON_ATTR) Dimension |
|
Enrolled Count |
Student Enrollment (PS_TF_STDNT_ENRL) Fact |