Student Cohort - Retention Rate Page
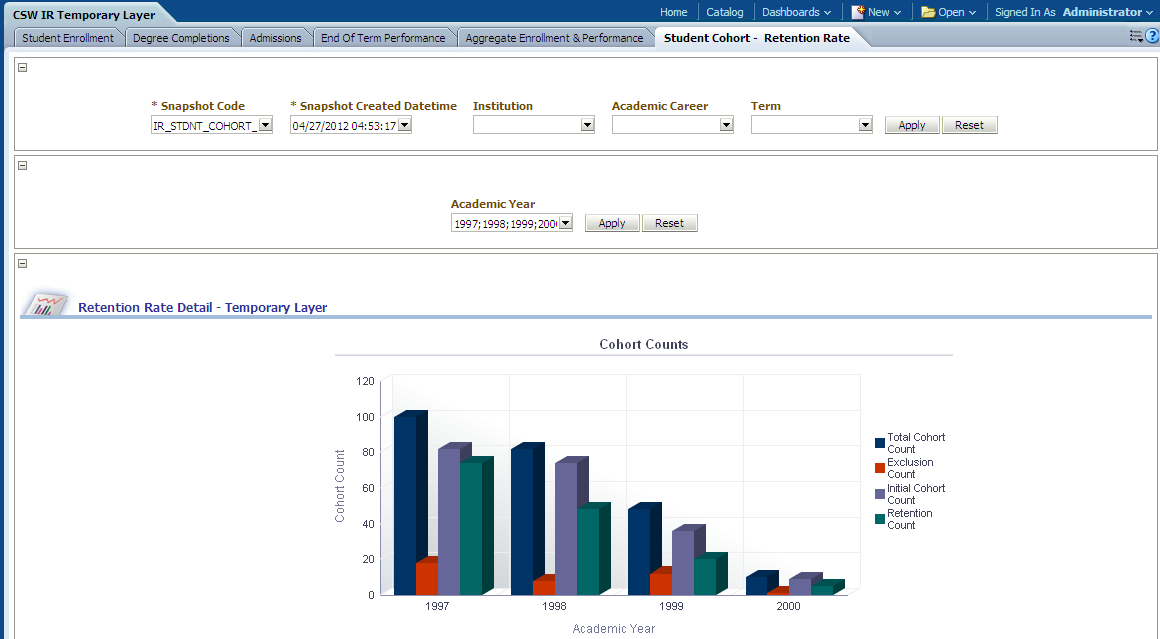
Use the Student Cohort - Retention Rate page to obtain an overview of one year student retention and overall graduation rates for the entire student body.
Image: Student Cohort - Retention Rate
Student Cohort - Retention Rate
|
Usage |
Reports |
Dashboard Prompt |
|---|---|---|
|
Provides you with an overview of one year student retention and overall graduation rates for the entire student body. |
This page is comprised of the following reports:
|
Use the Student Cohort - Retention Rate page prompts to filter page results by:
|
Retention Rate Detail Report
Access the Retention Rate Detail report, which enables you to analyze detailed retention rate data (such as retention and exclusion counts) by institution, gender, ethnicity, academic program, and so forth. This report helps analyze one year student retention.
Image: Retention Rate Detail report, part 1
Retention Rate Detail report, part 1
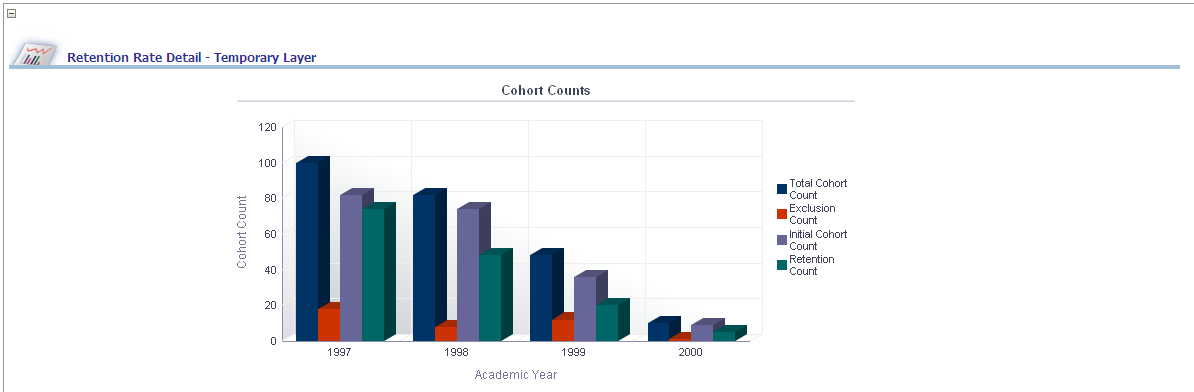
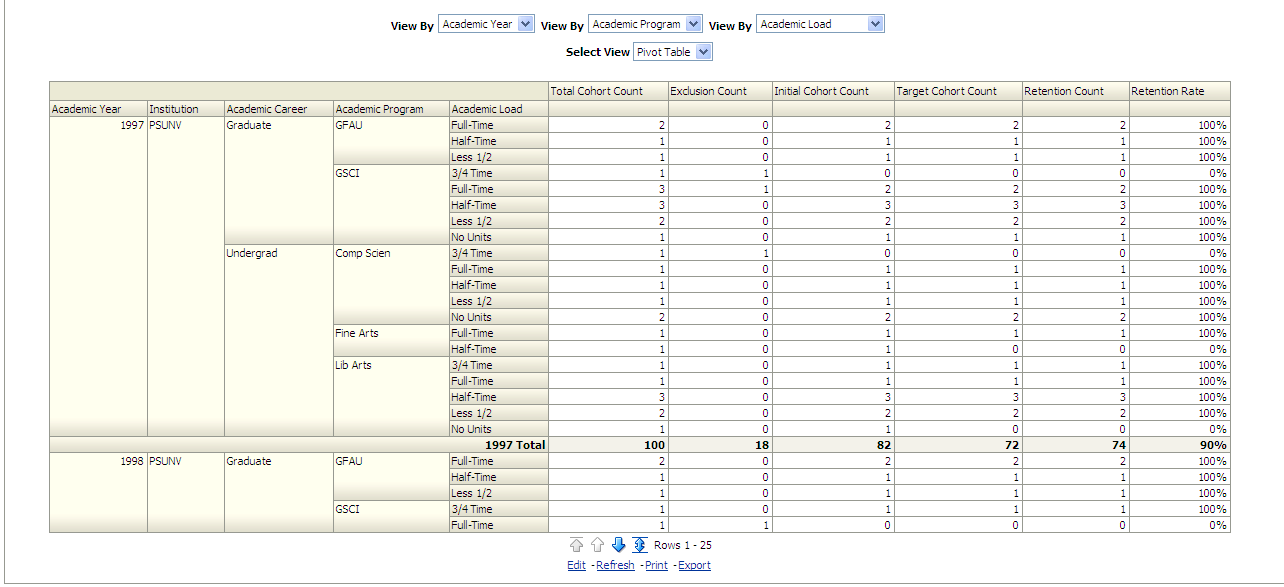
Image: Retention Rate Detail report, part 2
Retention Rate Detail report, part 2
|
X,Y Axis Graph Data |
|---|
|
The Retention Rate Detail graph displays academic year, academic program, and academic load data on the x-axis and cohort count data on the y-axis. The x-axis can also plot any of the following dimensions, depending on either of the three View By filter selections:
|
|
View By Filter (Left) |
View By Filter (Middle) |
View By Filter (Right) |
Select View |
|---|---|---|---|
|
Use this filter to view the Retention Rate Detail report results by:
Note: This filter affects only pivot view results. |
Use this filter to view the Retention Rate Detail graph and table results by:
|
Use this filter to view the Retention Rate Detail graph and table results by:
|
Use this filter to view the pivot table data in bar graph (chart) format. |
The following table lists the columns and measures used in the Retention Rate Detail report.
|
Report Column / Measure Name |
Report Column / Measure Origin |
|---|---|
|
Academic Career |
Academic Career (PS_TD_ACAD_CAR) Dimension |
|
Academic Level |
Academic Level (PS_TD_ACAD_LVL) Dimension |
|
Academic Load |
Academic Load (PS_TD_ACAD_LOAD) Dimension |
|
Academic Plan |
Academic Plan (PS_TD_ACAD_PLAN) Dimension |
|
Academic Program |
Academic Program (PS_TD_ACAD_PROG) Dimension |
|
Academic Subplan |
Academic Subplan (PS_TD_ACAD_SPLAN) Dimension |
|
Academic Year |
Year (PS_TD_YEAR) Dimension |
|
Admit Type |
Admit Type (PS_TD_ADMIT_TYPE) Dimension |
|
CIP Code (CIP_LD) |
Academic Plan (PS_TD_ACAD_PLAN) Dimension |
|
Ethnicity |
Person Attribute (PS_TD_PERSON_ATTR) Dimension |
|
Gender |
Person (PS_TD_PERSON) Dimension |
|
Institution |
Institution (D_INSTITUTION) Dimension |
|
Last School Attended |
Last School Attended (PS_TD_EXT_ORG) Dimension |
|
Term |
Term (D_TERM) Dimension |
|
Exclusion Count |
Retention, Persistence and Graduation Rate Detail (PS_TF_RATE_DTL) Fact |
|
Initial Cohort Count |
Retention, Persistence and Graduation Rate Detail (PS_TF_RATE_DTL) Fact |
|
Retention Count |
Retention, Persistence and Graduation Rate Detail (PS_TF_RATE_DTL) Fact |
|
Retention Rate |
Retention Count / Initial Cohort Count Retention, Persistence and Graduation Rate Detail (PS_TF_RATE_DTL) Fact |
|
Target Cohort Count |
Retention, Persistence and Graduation Rate Detail (PS_TF_RATE_DTL) Fact |
|
Total Cohort Count |
Retention, Persistence and Graduation Rate Detail (PS_TF_RATE_DTL) Fact |
Graduation Rate Analysis Report
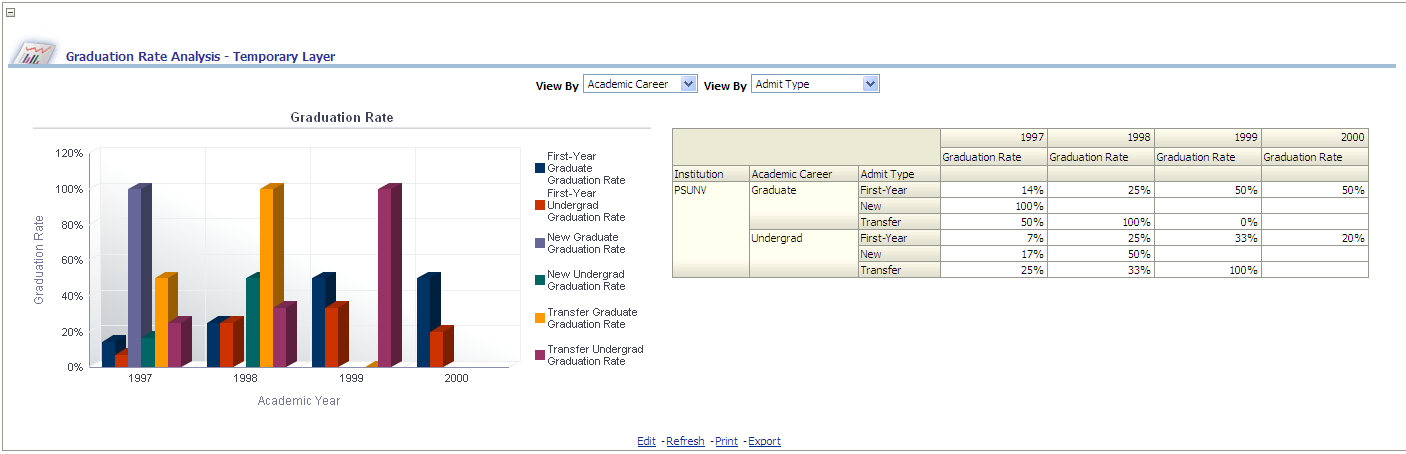
Access the Graduation Rate Analysis report, which enables you to analyze summarized graduation rate data by institution, gender, ethnicity, academic program, and so forth.
Image: Graduation Rate Analysis report
Graduation Rate Analysis report
|
X,Y Axis Graph Data |
View By Filter (Left) |
View By Filter (Right) |
|---|---|---|
|
The Graduation Rate Analysis graph displays academic year, academic career, and admit type data on the x-axis, and graduation rate data on the y-axis. The x-axis can also plot any of the following dimensions, depending on either of the two View By filter selections:
|
Use this filter to view the Graduation Rate Analysis report results by:
|
Use this filter to view the Graduation Rate Analysis report results by:
|
The following table lists the columns and measures used in the Graduation Rate Analysis report.
|
Report Column / Measure Name |
Report Column / Measure Origin |
|---|---|
|
Academic Career |
Academic Career (PS_TD_ACAD_CAR) Dimension |
|
Academic Level |
Academic Level (PS_TD_ACAD_LVL) Dimension |
|
Academic Load |
Academic Load (PS_TD_ACAD_LOAD) Dimension |
|
Academic Program |
Academic Program (PS_TD_ACAD_PROG) Dimension |
|
Academic Year |
Year (PS_TD_YEAR) Dimension |
|
Admit Type |
Admit Type (PS_TD_ADMIT_TYPE) Dimension |
|
Ethnicity |
Person Attribute (PS_TD_PERSON_ATTR) Dimension |
|
Gender |
Person (PS_TD_PERSON) Dimension |
|
Institution |
Institution (D_INSTITUTION) Dimension |
|
Last School Attended |
Last School Attended (PS_TD_EXT_ORG) Dimension |
|
Graduation Rate |
((If Student Degree conferral date is Null Then 1 Else 0)/Initial Cohort Count)*100 Retention, Persistence and Graduation Rate Detail (PS_TF_RATE_DTL) Fact |
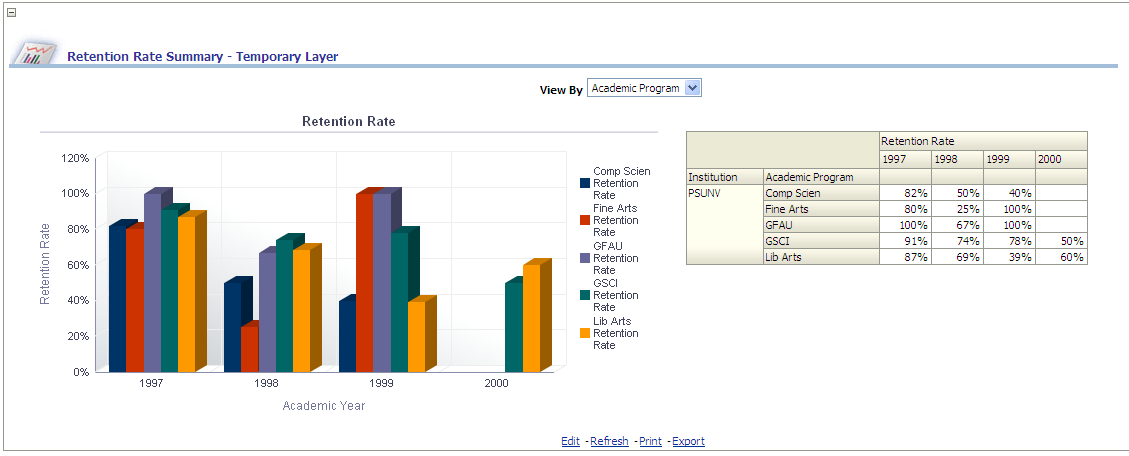
Retention Rate Summary Report
Access the Retention Rate Summary report, which enables you to analyze summarized retention rate data by institution, gender, ethnicity, academic program, and so forth. This report helps analyze one year student retention rate.
Image: Retention Rate Summary report
Retention Rate Summary report
|
X,Y Axis Graph Data |
View By Filter |
|---|---|
|
The Retention Rate Summary graph displays academic year and academic program data on the x-axis, and retention rate data on the y-axis. The x-axis can also plot any of the following dimensions, depending on the View By filter selection:
|
Use this filter to view the Retention Rate Summary report results by:
|
The following table lists the columns and measures used in the Retention Rate Summary report.
|
Report Column / Measure Name |
Report Column / Measure Origin |
|---|---|
|
Academic Level |
Academic Level (PS_TD_ACAD_LVL) Dimension |
|
Academic Load |
Academic Load (PS_TD_ACAD_LOAD) Dimension |
|
Academic Plan |
Academic Plan (PS_TD_ACAD_PLAN) Dimension |
|
Academic Program |
Academic Program (PS_TD_ACAD_PROG) Dimension |
|
Academic Subplan |
Academic Subplan (PS_TD_ACAD_SPLAN) Dimension |
|
Academic Year |
Year (PS_TD_YEAR) Dimension |
|
Admit Type |
Admit Type (PS_TD_ADMIT_TYPE) Dimension |
|
CIP Code (CIP_LD) |
Academic Plan (PS_TD_ACAD_PLAN) Dimension |
|
Ethnicity |
Person Attribute (PS_TD_PERSON_ATTR) Dimension |
|
Gender |
Person (PS_TD_PERSON) Dimension |
|
Institution |
Institution (D_INSTITUTION) Dimension |
|
Retention Rate |
(Target Cohort Count/Adjusted Initial Cohort Count) * 100 Retention, Persistence and Graduation Rate Detail (PS_TF_RATE_DTL) Fact |
|
Target Cohort Count |
Retention, Persistence and Graduation Rate Detail (PS_TF_RATE_DTL) Fact |
|
Total Cohort Count |
Retention, Persistence and Graduation Rate Detail (PS_TF_RATE_DTL) Fact |