Student Enrollment Page
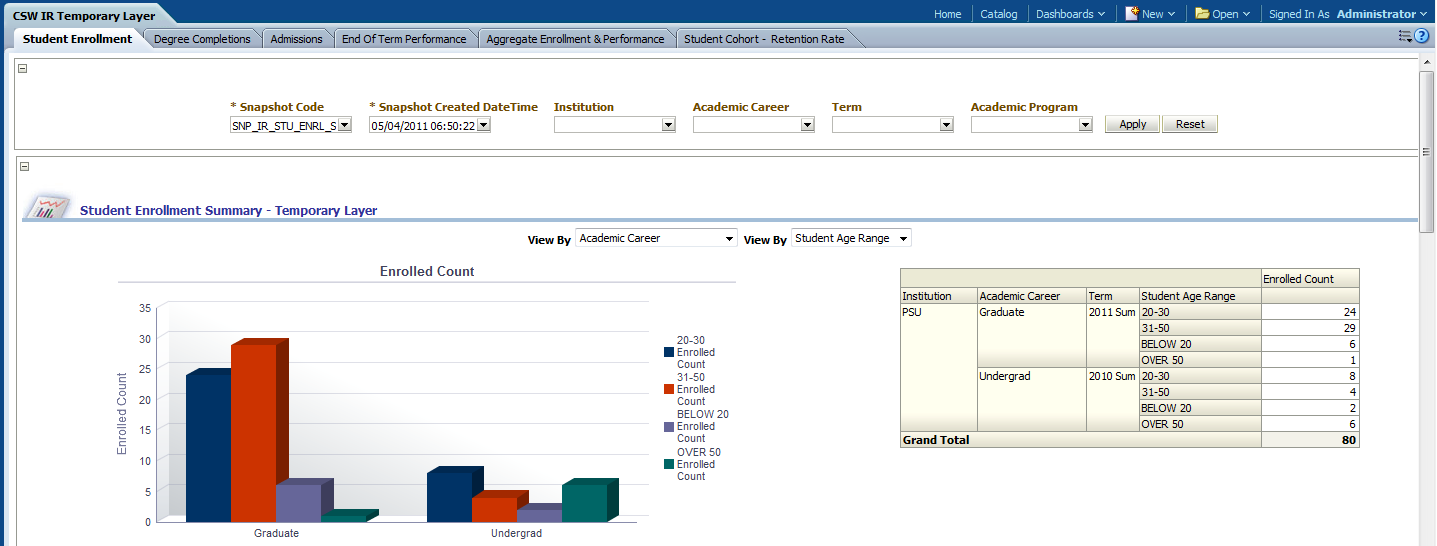
Use the Student Enrollment (temporary layer) page to obtain an overview of student enrollment and student enrollment by athlete and degree/non degree seeking individuals, for a given snapshot code and snapshot creation date and time.
Note: Since the reports and report fields for the temporary layer are identical to those in the frozen layer, documentation is provided for the temporary layer only.
Image: Student Enrollment (temporary layer) page
Student Enrollment (temporary layer) page
|
Usage |
Reports |
Dashboard Prompt |
|---|---|---|
|
Provides you with overview of student enrollment and student enrollment by athlete and degree/non degree seeking individuals, for a given snapshot code and snapshot creation date and time. |
This page is comprised of the following reports:
|
Use the Student Enrollment page prompts to filter page results by:
|
Student Enrollment Summary Report
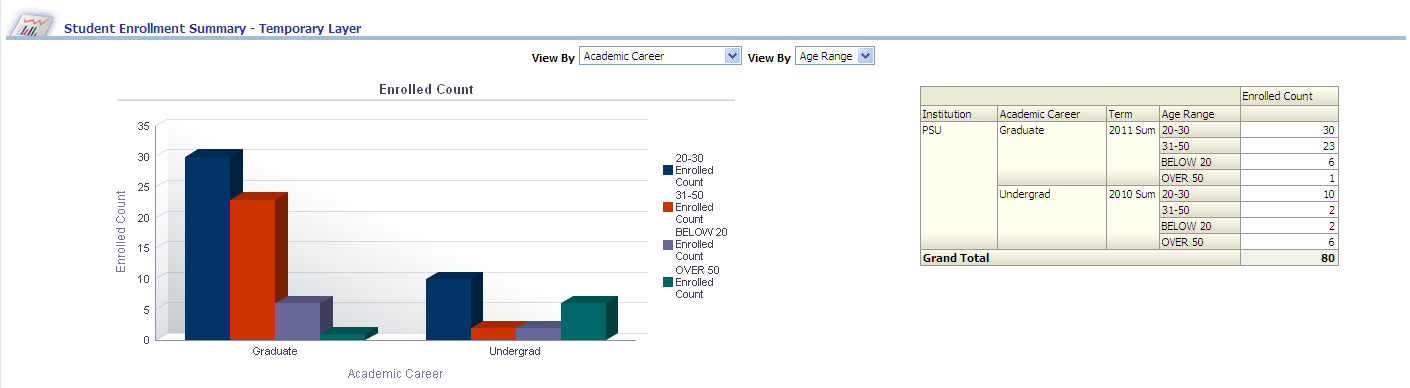
Access the Student Enrollment Summary (temporary) report, which enables you to analyze enrolled students by academic level, age range, gender, ethnicity, and so forth.
Image: Student Enrollment Summary (temporary) report
Student Enrollment Summary (temporary layer) report
|
X,Y Axis Data |
View by Filter (Left) |
View by Filter (Right) |
|---|---|---|
|
The Student Enrollment Summary graph displays academic career and age range data on the x-axis and enrollment count data on the y-axis. The x-axis can also plot any of the following dimensions, depending on either of the two View By filter selections:
|
Use this filter to view the Student Enrollment Summary report results by:
|
Use this filter to view the Student Enrollment Summary report results by:
|
The following table lists the columns and measures used in the Student Enrollment Summary report.
|
Report Column / Measure Name |
Report Column / Measure Origin |
|---|---|
|
Academic Career |
Academic Career (PS_TD_ACAD_CAR) Dimension |
|
Academic Level |
Academic Level (PS_TD_ACAD_LVL) Dimension |
|
Academic Load |
Academic Load (PS_TD_ACAD_LOAD) Dimension |
|
Academic Program |
Academic Program (PS_TD_ACAD_PROG) Dimension |
|
Admit Type |
Admit Type (PS_TD_ADMIT_TYPE) Dimension |
|
Campus |
Campus (PS_TD_CAMPUS) Dimension |
|
Last School Attended |
Last School Attended (PS_TD_EXT_ORG) Dimension |
|
Ethnicity |
Person Attribute (PS_TD_PERSON_ATTR) Dimension |
|
Age Range |
Person (PS_TD_PERSON) Dimension |
|
Gender |
Person (PS_TD_PERSON) Dimension |
|
Enrolled Count |
Student Enrollment (PS_TF_STDNT_ENRL) Fact |
Degree Seeking Students Summary Report
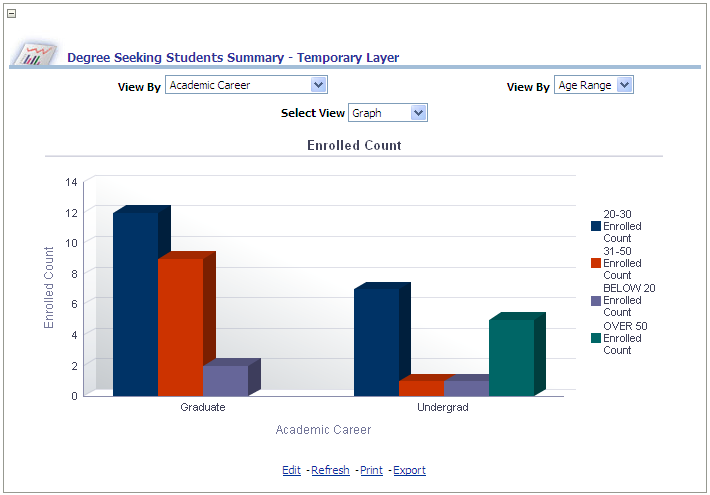
Access the Degree Seeking Students Summary report, which enables you to analyze degree seeking student enrollment by academic level, age range, gender, ethnicity, and so forth.
Image: Degree Seeking Students Summary (temporary) report
Degree Seeking Students Summary report
|
X,Y Axis Data |
View By Filter (Left) |
View By Filter (Right) |
Select View |
|---|---|---|---|
|
The Degree Seeking Students Summary graph displays academic career and age range data on the x-axis and enrollment count data for degree seeking students on the y-axis. The x-axis can also plot any of the following dimensions, depending on either of the two View By filter selections:
|
Use this filter to view the Degree Seeking Students Summary report results by:
|
Use this filter to view the Degree Seeking Students Summary report results by:
|
Use this filter to:
|
The following table lists the columns and measures used in the Degree Seeking Students Summary report.
|
Report Column / Measure Name |
Report Column / Measure Origin |
|---|---|
|
Academic Career |
Academic Career (PS_TD_ACAD_CAR) Dimension |
|
Academic Level |
Academic Level (PS_TD_ACAD_LVL) Dimension |
|
Academic Load |
Academic Load (PS_TD_ACAD_LOAD) Dimension |
|
Campus |
Campus (PS_TD_CAMPUS) Dimension |
|
Last School Attended |
Last School Attended (PS_TD_EXT_ORG) Dimension |
|
Ethnicity |
Person Attribute (PS_TD_PERSON_ATTR) Dimension |
|
Age Range |
Person (PS_TD_PERSON) Dimension |
|
Gender |
Person (PS_TD_PERSON) Dimension |
|
Enrolled Count |
Student Enrollment (PS_TF_STDNT_ENRL) Fact |
Non Degree Seeking Students Summary Report
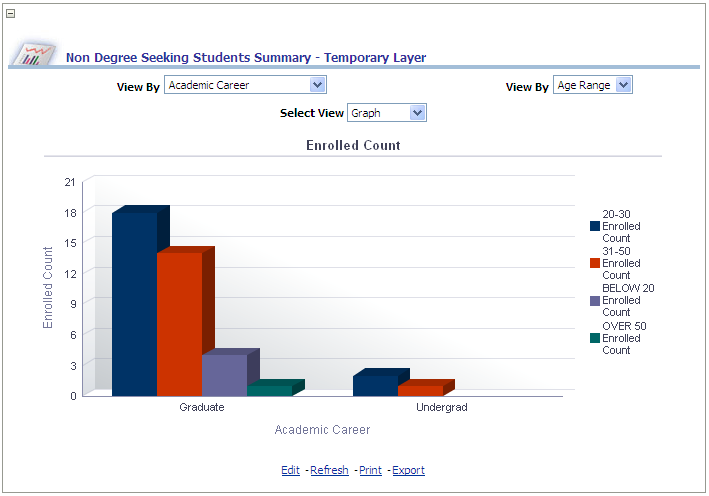
Access the Non Degree Seeking Students Summary report, which enables you to analyze non degree seeking student enrollment by academic level, age range, gender, ethnicity, and so forth.
Image: Non Degree Seeking Students Summary (temporary) report
Non Degree Seeking Students Summary report
|
X,Y Axis Data |
View By Filter (Left) |
View By Filter (Right) |
Select View |
|---|---|---|---|
|
The Non Degree Seeking Students Summary graph displays academic career and age range data on the x-axis and enrollment count data for non degree seeking students on the y-axis. The x-axis can also plot any of the following dimensions, depending on either of the two View By filter selections:
|
Use this filter to view the Non Degree Seeking Students Summary report results by:
|
Use this filter to view the Non Degree Seeking Students Summary report results by:
|
Use this filter to:
|
The following table lists the columns and measures used in the Non Degree Seeking Students Summary report.
|
Report Column / Measure Name |
Report Column / Measure Origin |
|---|---|
|
Academic Career |
Academic Career (PS_TD_ACAD_CAR) Dimension |
|
Academic Level |
Academic Level (PS_TD_ACAD_LVL) Dimension |
|
Academic Load |
Academic Load (PS_TD_ACAD_LOAD) Dimension |
|
Campus |
Campus (PS_TD_CAMPUS) Dimension |
|
Last School Attended |
Last School Attended (PS_TD_EXT_ORG) Dimension |
|
Ethnicity |
Person Attribute (PS_TD_PERSON_ATTR) Dimension |
|
Age Range |
Person (PS_TD_PERSON) Dimension |
|
Gender |
Person (PS_TD_PERSON) Dimension |
|
Enrolled Count |
Student Enrollment (PS_TF_STDNT_ENRL) Fact |
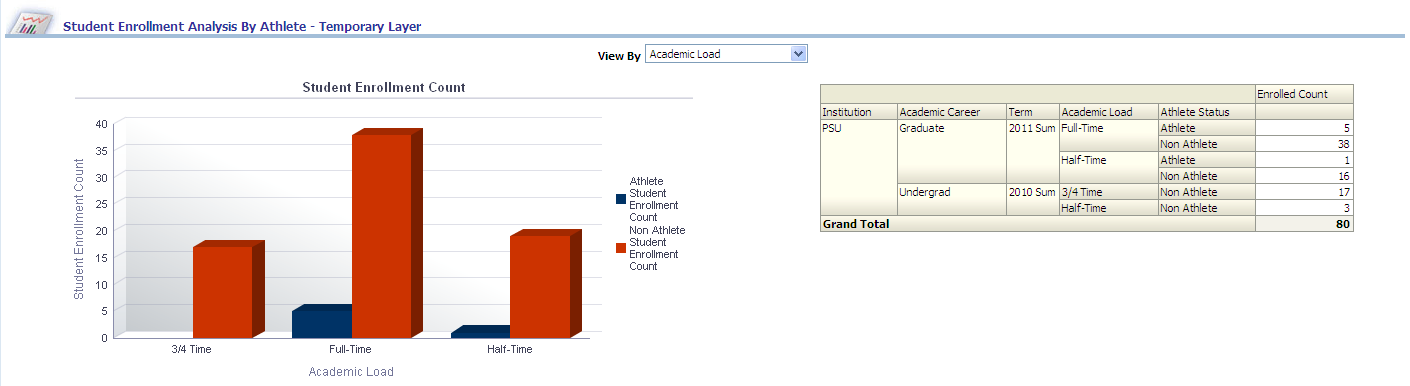
Student Enrollment Analysis By Athlete Report
Access the Student Enrollment Analysis By Athlete report, which enables you to analyze student athlete enrollment by academic level, age range, gender, ethnicity, and so forth.
Image: Student Enrollment Analysis By Athlete (temporary) report
Student Enrollment Analysis By Athlete report
|
X,Y Axis Data |
View By Filter |
|---|---|
|
The Student Enrollment Analysis By Athlete graph displays academic load and age range data on the x-axis and student enrollment count data for athletes and non-athletes on the y-axis. The x-axis can also plot any of the following dimensions, depending on your View By filter selection:
|
Use this filter to view the Student Enrollment Analysis By Athlete report results by:
|
The following table lists the columns and measures used in the Student Enrollment Analysis By Athlete report.
|
Report Column / Measure Name |
Report Column / Measure Origin |
|---|---|
|
Academic Career |
Academic Career (PS_TD_ACAD_CAR) Dimension |
|
Academic Level |
Academic Level (PS_TD_ACAD_LVL) Dimension |
|
Academic Load |
Academic Load (PS_TD_ACAD_LOAD) Dimension |
|
Admit Type |
Admit Type (PS_TD_ADMIT_TYPE) Dimension |
|
Campus |
Campus (PS_TD_CAMPUS) Dimension |
|
Last School Attended |
Last School Attended (PS_TD_EXT_ORG) Dimension |
|
Ethnicity |
Person Attribute (PS_TD_PERSON_ATTR) Dimension |
|
Age Range |
Person (PS_TD_PERSON) Dimension |
|
Gender |
Person (PS_TD_PERSON) Dimension |
|
Enrolled Count |
Student Enrollment (PS_TF_STDNT_ENRL) Fact |