Admission/Application Process Page
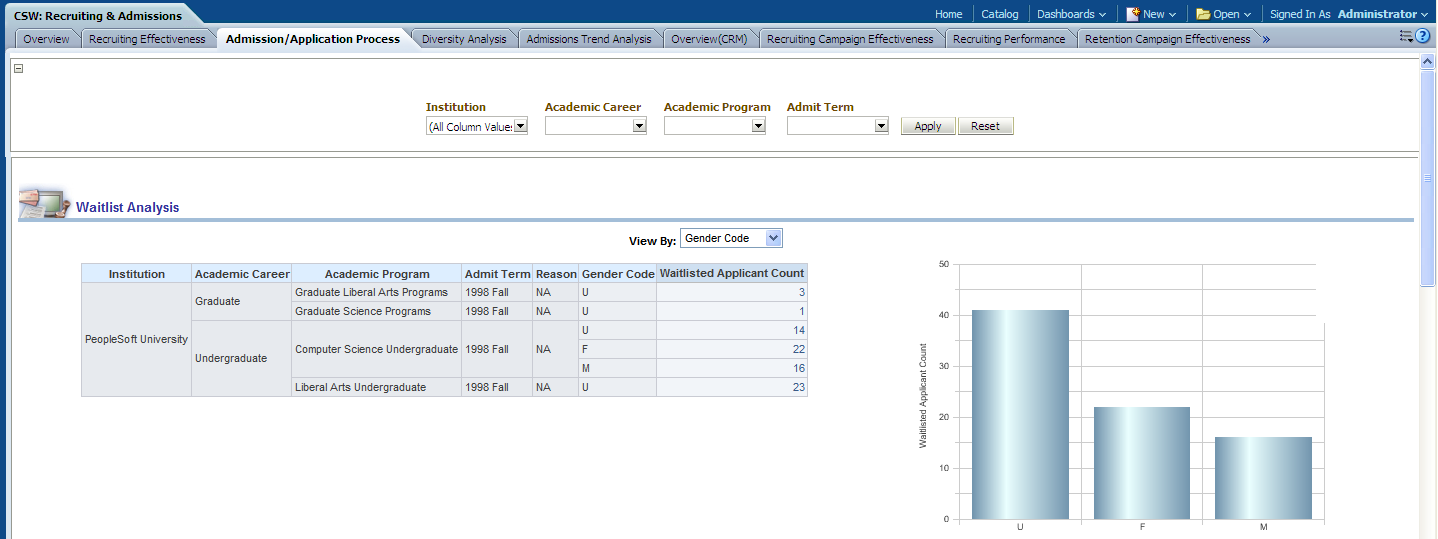
Use the Admission/Application Process page to provide you with an overview of the effectiveness of your admissions and application process for your institution.
Image: Admission/Application Process page
Admission/Application Process page.
|
Usage |
Reports |
Dashboard Prompt |
|---|---|---|
|
Provides you with an overview of the effectiveness of your admissions and application process for your institution. |
This page is comprised of the following reports:
|
Use the Admission/Application Process page prompt to filter page results by:
|
Checklist Analysis Report
The Checklist Analysis report enables you to track checklists for students and external organizations.
Typically, checklist functionality supports the recruitment function by tracking lists of requirements between the university admissions office and prospective or accepted students.
Image: Checklist Analysis report
Checklist Analysis report.
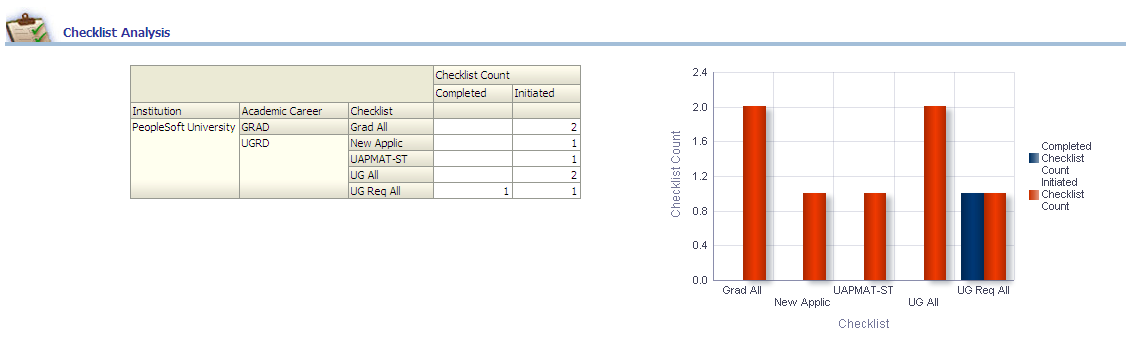
The Checklist Analysis graph displays Checklist (type) by Initiated / Completed data on the x-axis and Checklist Count data on the y-axis.
|
Report Column / Measure Name |
Report Column / Measure Origin |
|---|---|
|
Academic Career |
Academic Career (D_ACAD_CAR) Dimension |
|
Institution |
Institution (D_INSTITUTION) Dimension |
|
Checklist (Code) |
Checklist Code (D_CHKLST_CD) Dimension |
|
Checklist Status |
Checklist Status (D_CHKLST_STAT) Dimension |
|
Checklist Count |
Checklist Person (F_CHKLST_PERSON) Fact |
Waitlist Analysis Report
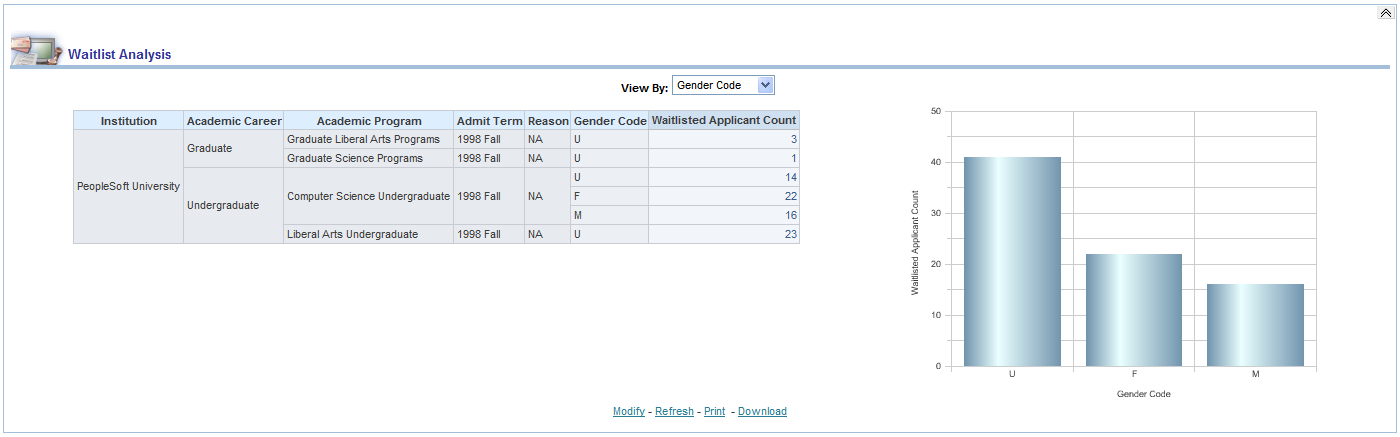
The Waitlist Analysis report enables you to evaluate the results of your waitlist strategy and provides details about waitlisted applicants by academic career, academic program, gender, admit term, and so forth.
Image: Waitlist Analysis report
This example illustrates the fields and controls on the Waitlist Analysis report. You can find definitions for the fields and controls later on this page.
|
X,Y Axis Data |
View By Filter |
|---|---|
|
The Waitlist Analysis graph displays Gender Code data on the x-axis and Waitlisted Applicant Count data on the y-axis. The x-axis can also display any of the following dimensions, depending on your View By filter selection:
Note: You can click on graph data to review drill down data for a particular gender code, ethnic group, and so forth. |
Use this filter to view the report results by:
|
|
Report Column / Measure Name |
Report Column / Measure Origin |
|---|---|
|
Academic Career |
Academic Career (D_ACAD_CAR) Dimension |
|
Academic Program |
Academic Program (D_ACAD_PROG) Dimension |
|
Admit Term |
Admit Term (D_TERM) Dimension |
|
Admit Type |
Admit Type (D_ADMIT_TYPE) Dimension |
|
Ethnic Category |
Person (D_PERSON) Dimension |
|
Ethnic Group |
Person (D_PERSON) Dimension |
|
Gender Code |
Person (D_PERSON) Dimension |
|
Institution |
Institution (D_INSTITUTION) Dimension |
|
Reason |
Program Action Reason (D_PROG_ACN_RSN) Dimension |
|
Waitlist Applicant Count |
Admission Application Status (F_ADM_APPL_STAT) Fact |
Student Response Analysis - Reason Report
The Student Response Analysis - Reason report enables you to evaluate the number of student responses and reason by academic career, academic program, admit term, and so forth. The Student Response Analysis Reason report details student response reasons for an application.
Image: Student Response Analysis Reason report
Student Response Analysis - Reason report.
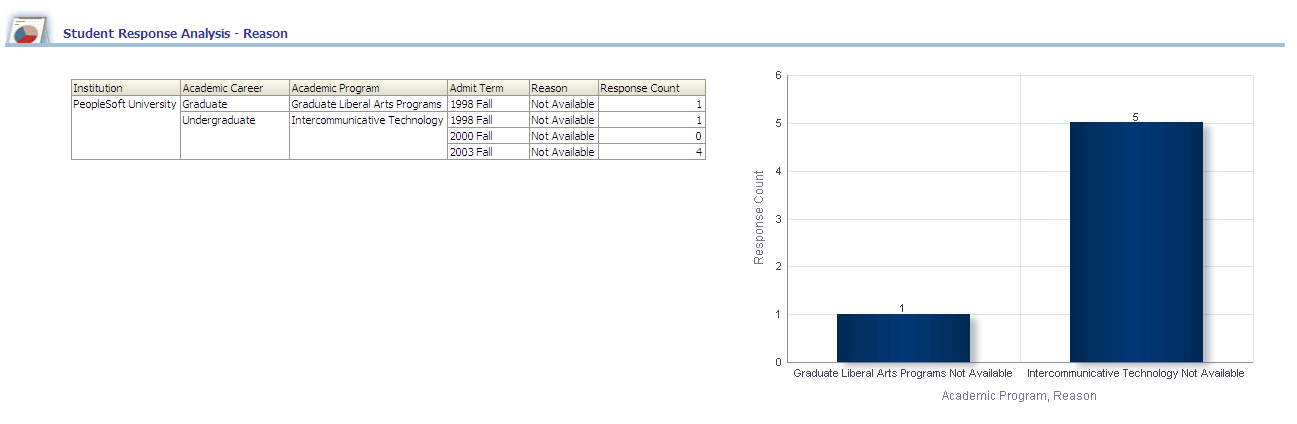
The Student Response Analysis - Reason graph displays Academic Program by Reason data on the x-axis and Response Count data on the y-axis.
|
Report Column / Measure Name |
Report Column / Measure Origin |
|---|---|
|
Academic Career |
Academic Career (D_ACAD_CAR) Dimension |
|
Academic Program |
Academic Program (D_ACAD_PROG) Dimension |
|
Admit Term |
Admit Term (D_TERM) Dimension |
|
Institution |
Institution (D_INSTITUTION) Dimension |
|
Reason |
Response Reason (D_RESP_RSN) Dimension |
|
Response Count |
Student Response (F_STDNT_RESP) Fact |
Student Response Analysis Report
The Student Response Analysis report enables you to evaluate the number of student responses by academic career, academic program, admit term, and so forth.
The Student Response Analysis report details student responses (positive or negative) for an application.
Image: Student Response Analysis report
Student Response Analysis report.
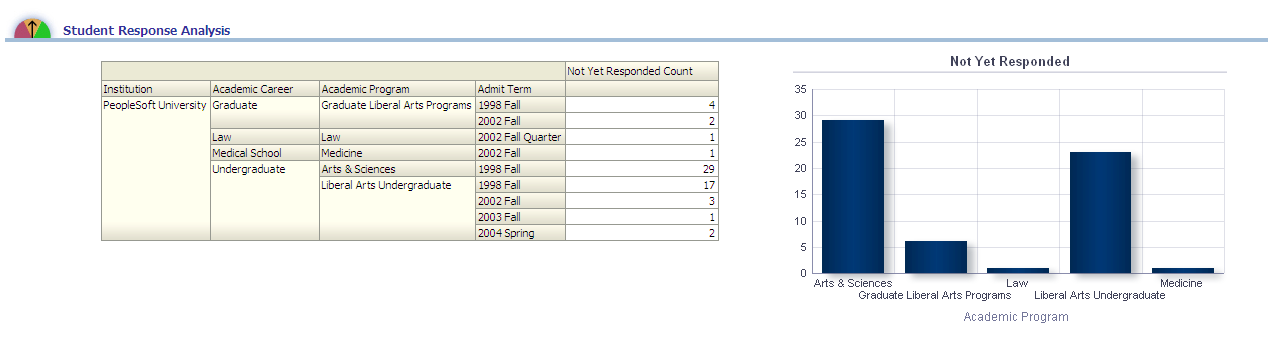
The Student Response Analysis graph displays Academic Program data on the x-axis and Admit Count data on the y-axis.
|
Report Column / Measure Name |
Report Column / Measure Origin |
|---|---|
|
Academic Career |
Academic Career (D_ACAD_CAR) Dimension |
|
Academic Program |
Academic Program (D_ACAD_PROG) Dimension |
|
Admit Term |
Admit Term (D_TERM) Dimension |
|
Institution |
Institution (D_INSTITUTION) Dimension |
|
Program Status |
Program Status (D_PROG_STAT) Dimension |
|
Admit Count |
Admission Funnel (F_ADM_FUNNEL) Fact |
|
Confirm Count |
Admission Funnel (F_ADM_FUNNEL) Fact |
|
Enrollment Count |
Admission Funnel (F_ADM_FUNNEL) Fact |