Diversity Analysis Page
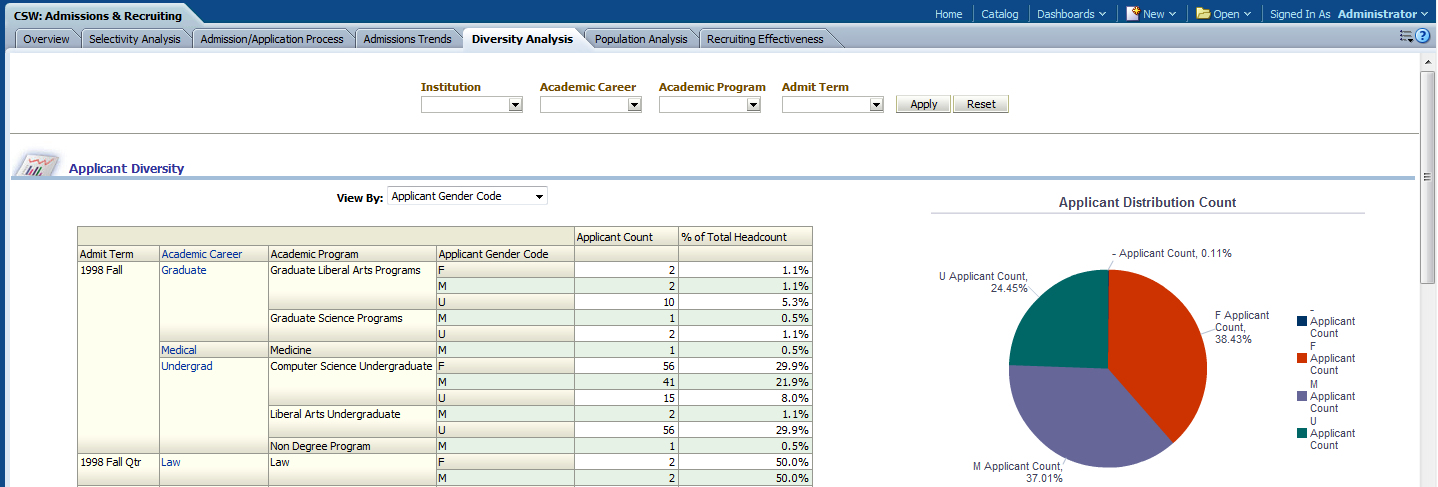
The Diversity Analysis page provides you with a birds eye view of the diversity of the student population admitted into your institution.
Image: Diversity Analysis page
Diversity Analysis page
|
Usage |
Reports |
Dashboard Prompt |
|---|---|---|
|
Provides you with a birds eye view of the diversity of the student population admitted into your institution. |
This page is comprised of the following reports:
|
Use the Diversity Analysis page prompt to filter page results by:
|
Applicant Diversity Report
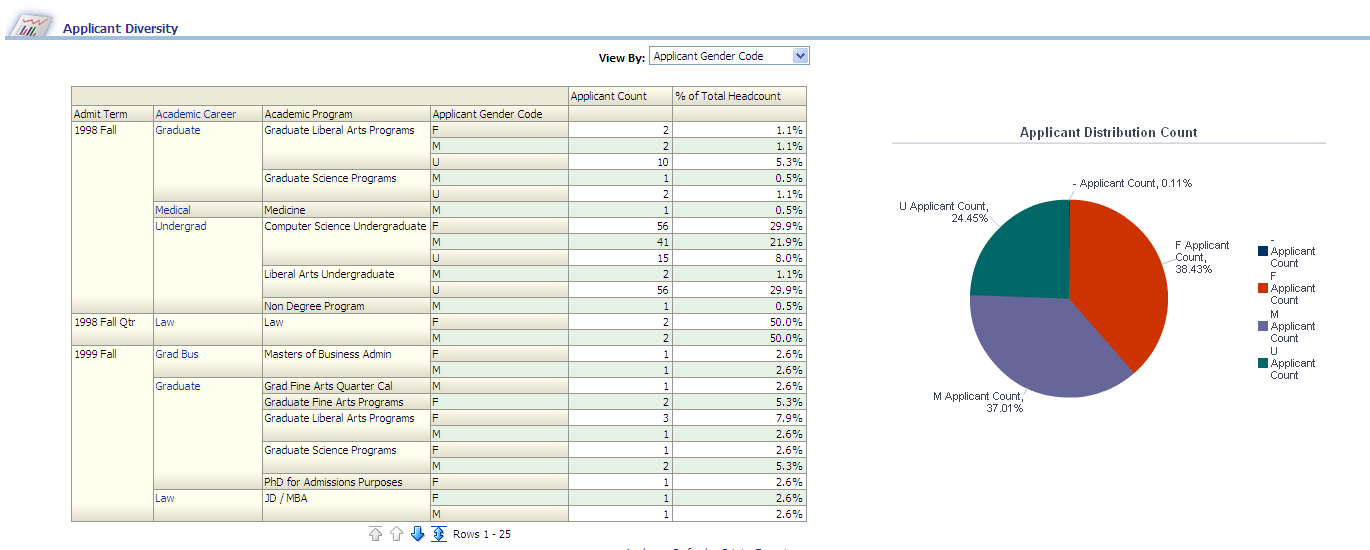
Access the Applicant Diversity report, which enables you to evaluate the diversity of the student population admitted into your institution, providing details about the gender and ethnic group to which students belong.
Image: Applicant Diversity report
Applicant Diversity report.
|
Pie Chart Data |
View By Filter |
|---|---|
|
The Applicant Diversity pie chart displays Applicant Count data grouped by Applicant Gender Code. Applicant count data can also be grouped by any of the following dimensions, depending on your View By filter selection:
|
Use this filter to filter report results by:
|
|
Column / Measure Name |
Column / Measure Origin |
|---|---|
|
Academic Career |
Academic Career (D_ACAD_CAR) Dimension |
|
Academic Program |
Academic Program (D_ACAD_PROG) Dimension |
|
Admit Term |
Admit Term (D_TERM) Dimension |
|
Applicant Ethnic Category |
Person (D_PERSON) Dimension |
|
Applicant Ethnic Group |
Person (D_PERSON) Dimension |
|
Applicant Gender Code |
Person (D_PERSON) Dimension |
|
Applicant Count |
Admission Application Status (F_ADM_APPL_STAT) Fact |
|
% of Total Headcount |
(Applicant Count / Total Applicants) * 100 |
Undergraduate Admissions Report
Access the Undergraduate Admissions report, which enables you to evaluate the diversity of the undergraduate student population admitted into your institution and determine the gender and ethnic group to which those students belong.
Image: Undergraduate Admissions report, part 1
Undergraduate Admissions report, part 1.
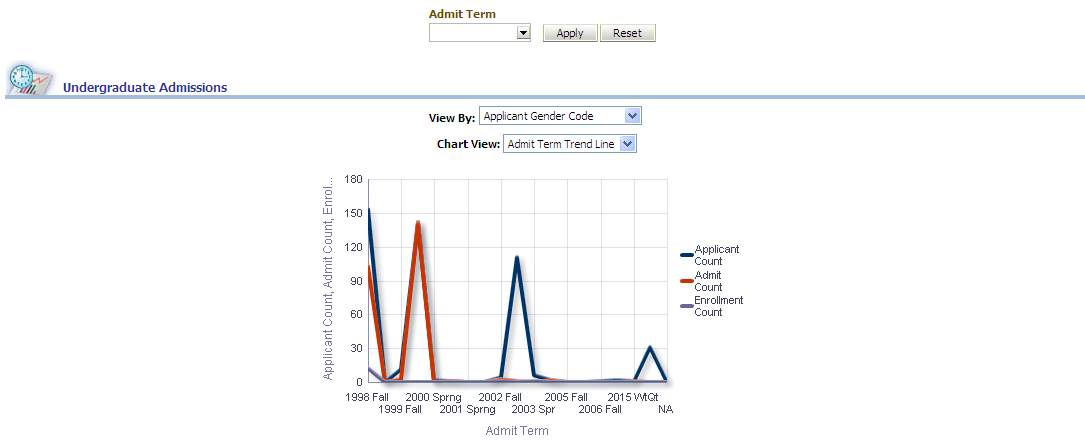
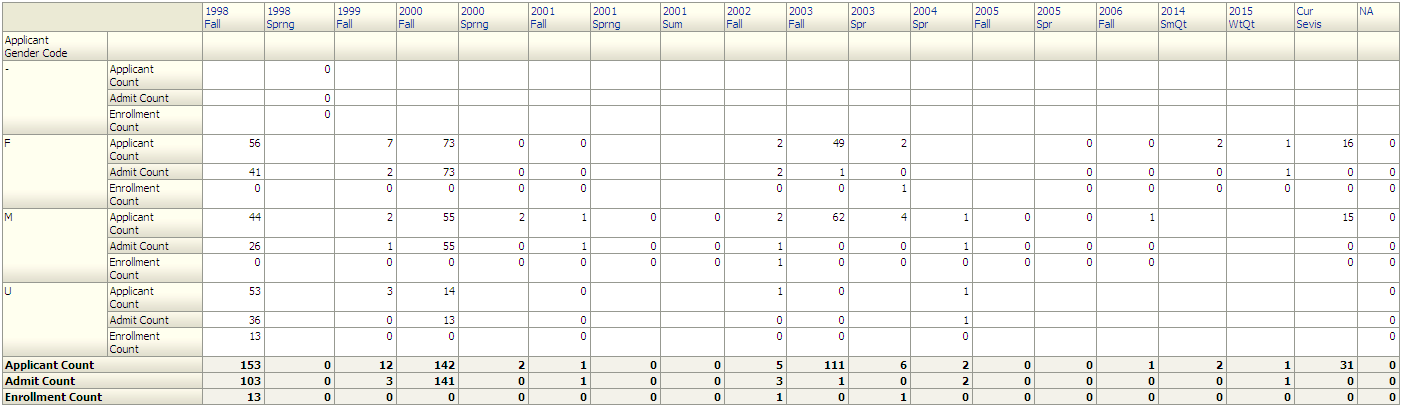
Image: Undergraduate Admissions report, part 2
Undergraduate Admissions report, part 2.
|
X,Y Axis Data |
Top Level Filters |
View By Filter |
Chart View Filter |
|---|---|---|---|
|
The Undergraduate Admissions chart displays Admit Term data on the x-axis and Applicant Count, Admit Count, and Enrollment Count data on the y-axis. |
Use this top level report filters to refine the report results by:
|
Use this filter to view the table report results by:
|
Use this filter to:
|
|
Report Column / Measure Name |
Report Column / Measure Origin |
|---|---|
|
Academic Career |
Academic Career (D_ACAD_CAR) Dimension |
|
Admit Term |
Admit Term (D_TERM) Dimension |
|
Applicant Gender Code |
Person (D_PERSON) Dimension |
|
Applicant Ethnic Group |
Person (D_PERSON) Dimension |
|
Admit Count |
Admission Funnel (F_ADM_FUNNEL) Fact |
|
Applicant Count |
Admission Application Status (F_ADM_APPL_STAT) Fact |
|
Enrollment Count |
Admission Funnel (F_ADM_FUNNEL) Fact |