Using the CSW: Admissions and Recruiting Dashboard - Overview Page
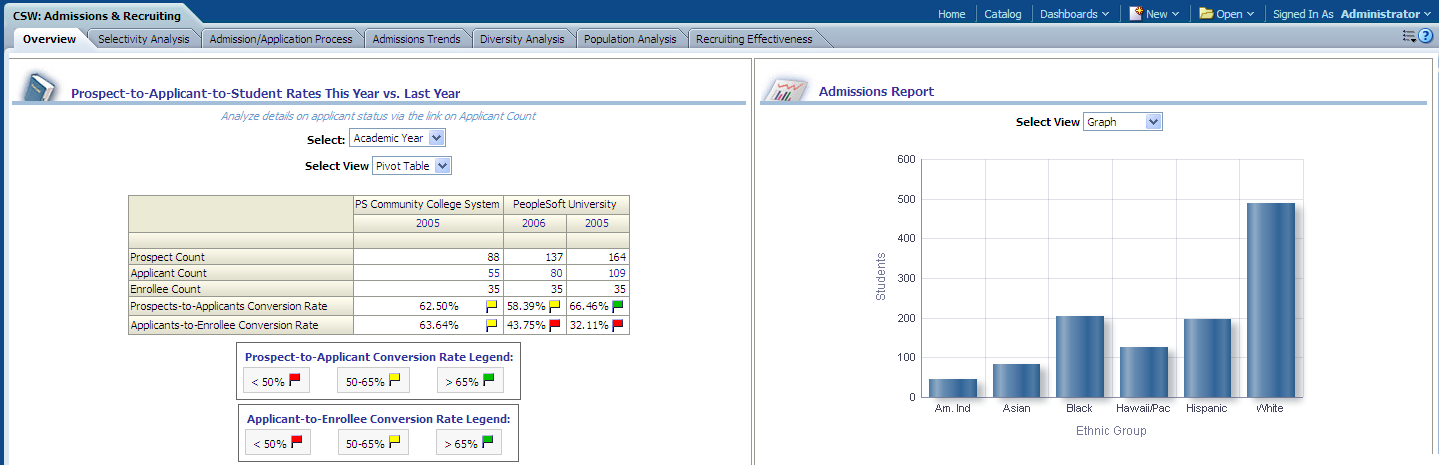
Access the Admissions and Recruiting - Overview page.
Image: Admissions and Recruiting - Overview page
Admissions and Recruiting - Overview page
|
Usage |
Reports |
|---|---|
|
Provides you with an overview of the Prospect to applicant to admit and enrollees numbers, ratios and yields for your institution. |
This page is comprised of the following reports:
|
Prospect-to-Applicant-to-Student Rates This Year vs. Last Year Report
Use the Prospect-to-Applicant-to-Student Rates This Year vs. Last Year report, which enables you to analyze prospect, admit and enrollment counts and conversion rates.
Image: Prospect-to-Applicant-to-Student Rates This Year vs. Last Year report
This example illustrates the fields and controls on the Prospect-to-Applicant-to-Student Rates This Year vs. Last Year report. You can find definitions for the fields and controls later on this page.
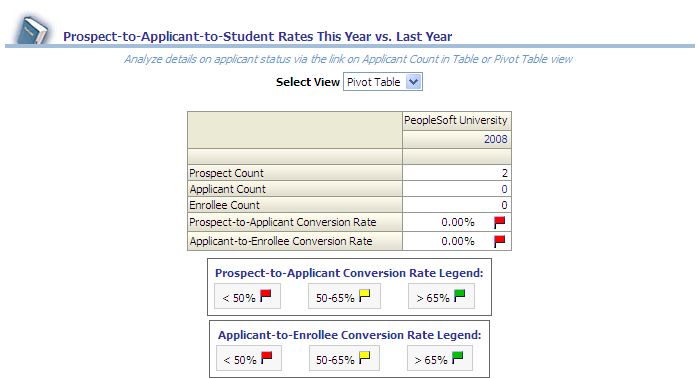
Use the Select View filter to:
view the data in bar chart format
view the data in pivot table format
view the data in table format
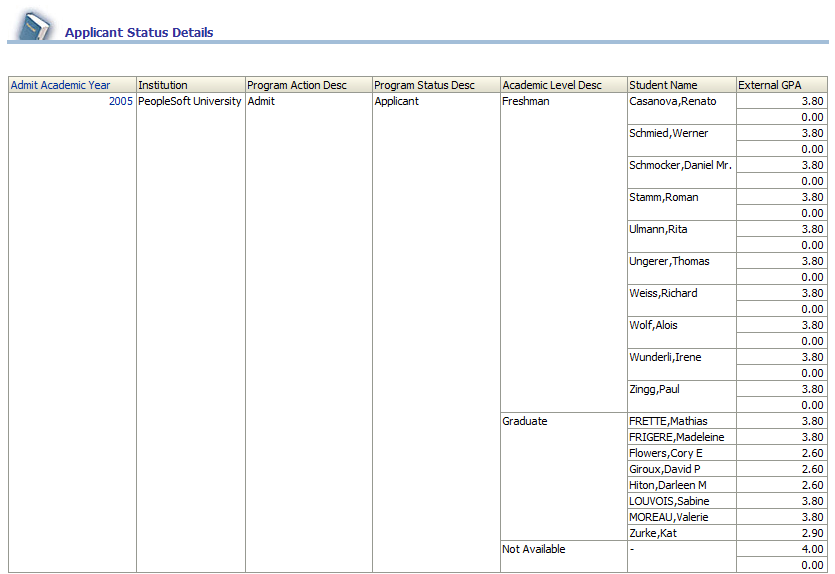
Applicant Status Details Report (Prospect-to-Applicant-to-Student Rates This Year vs. Last Year Report Drilldown)
Access the Applicant Status Details report by clicking on the Prospect-to-Applicant-to-Student Rates This Year vs. Last Year report’s Applicant Count value.
Using this drill down report, you can analyze details on applicant status and detailed information for each applicant for the selected admit academic year.
Image: Applicant Status Details report
Applicant Status Details report
The following table lists the columns and measures used in the Applicant Status Details report.
|
Report Column / Measure Name |
Report Column / Measure Origin |
|---|---|
|
Admit Academic Year |
Term (D_TERM) Dimension |
|
Institution |
Institution (D_INSTITUTION) Dimension |
|
Program Action Description |
Program Action (D_PROG_ACN) Dimension |
|
Program Status Description |
Program Status (D_PROG_STAT) Dimension |
|
Academic Level Description |
Academic Level (D_ACAD_LVL) Dimension |
|
Student Name |
Person (D_PERSON) Dimension |
|
External GPA |
External Academic Summary (F_EXT_ACAD_SUM) Fact |
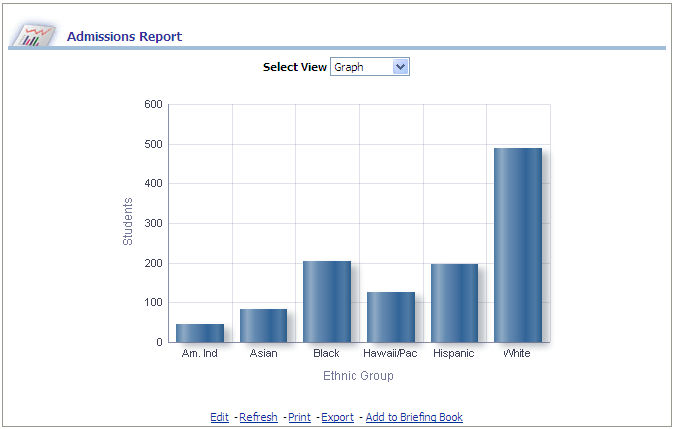
Admissions Report
Access the Admissions report, which provides a count of students admitted by class percentile ranking and ethnicity.
Image: Admissions report
Admissions report
|
X,Y Axis Data |
Select View |
|---|---|
|
The Admissions graph displays student ethnic group data on the x-axis and student count on the y-axis. |
Use this filter to:
|
The following table lists the columns and measures used in the Admissions report.
|
Report Column / Measure Name |
Report Column / Measure Origin |
|---|---|
|
Ethnic Group |
Person (D_PERSON, D_ETHNIC_GRP) Dimension |
|
Student Name |
Person (D_PERSON) Dimension |
|
Count |
External Academic Summary (F_EXT_ACAD_SUMM) Fact |
|
Decile |
External Academic Summary (F_EXT_ACAD_SUMM) Fact |
|
Class Percentile |
External Academic Summary (F_EXT_ACAD_SUMM) Fact |
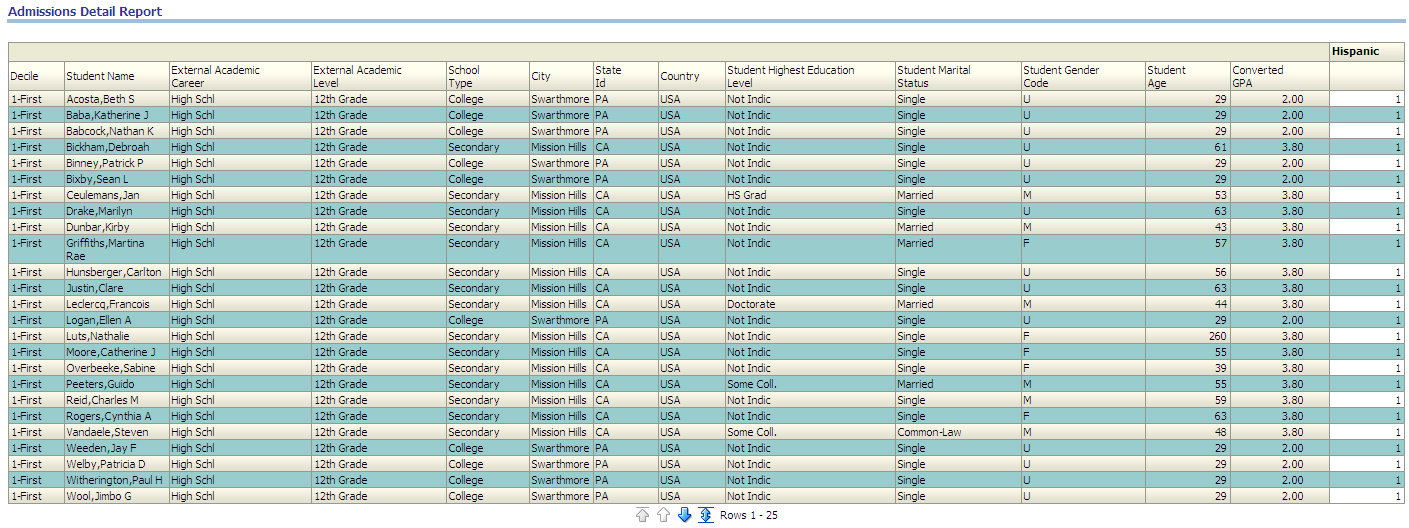
Admissions Detail Report (Admissions Report Drilldown)
Access the Admissions Detail report by clicking on the Ethnic Group bar in the graph or column header in the Admissions report pivot table. The Admissions Detail report displays detailed student information for each student grouped in deciles.
Image: Admissions Detail report
Admissions Detail report
The following table lists the columns and measures used in the Admissions Detail report.
|
Report Column / Measure Name |
Report Column / Measure Origin |
|---|---|
|
Ethnic Group |
Person (D_PERSON) Dimension |
|
Student Name |
Person (D_PERSON) Dimension |
|
Count |
External Academic Summary (F_EXT_ACAD_SUMM) Fact |
|
External Academic Career |
Academic Career (D_ACAD_CAR) Dimension |
|
External Academic Level |
Academic Level (D_ACAD_LVL) Dimension |
|
School Type |
External Organization (D_EXT_ORG) Dimension |
|
City |
External Organization (D_EXT_ORG) Dimension |
|
State ID |
External Organization (D_EXT_ORG) Dimension |
|
Country |
External Organization (D_EXT_ORG) Dimension |
|
Student Highest Education Level |
Person (D_PERSON) Dimension |
|
Student Marital Status |
Person (D_PERSON) Dimension |
|
Student Age |
Person (D_PERSON) Dimension |
|
Decile |
External Academic Summary (F_EXT_ACAD_SUMM) Fact |
|
Class Percentile |
External Academic Summary (F_EXT_ACAD_SUMM) Fact |
|
Converted GPA |
External Academic Summary (F_EXT_ACAD_SUMM) Fact |
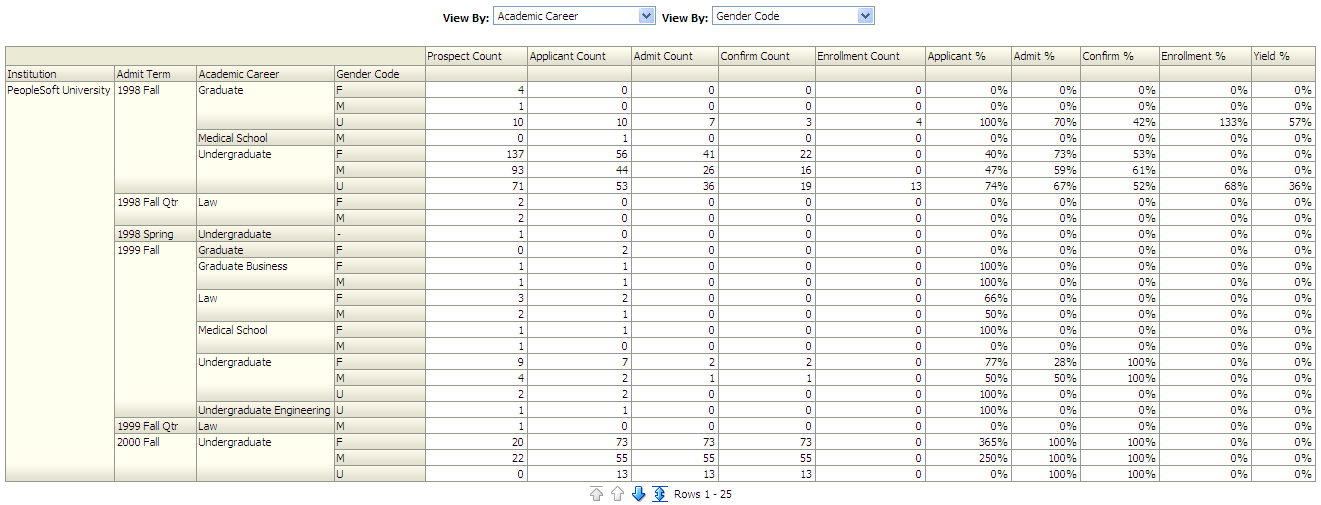
Admissions Funnel Report
Use the Admissions Funnel report, which provides you with an overview of student prospect, applicant, admit, and enrollment measures for your institution.
Image: Admissions Funnel report, part 1
This example illustrates the fields and controls on the Admissions Funnel report, part 1. You can find definitions for the fields and controls later on this page.
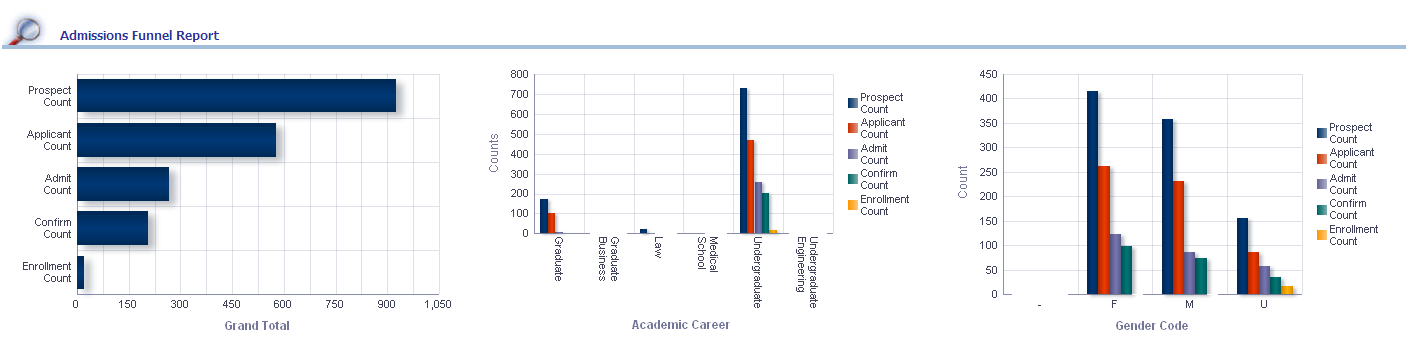
Image: Admissions Funnel report, part 2
This example illustrates the fields and controls on the Admissions Funnel report, part 2. You can find definitions for the fields and controls later on this page.
|
X,Y Axis Data for Bar Chart 1 |
X,Y Axis Data for Bar Chart 2 |
X,Y Axis Data for Bar Chart 3 |
|---|---|---|
|
The first Admissions Funnel graph displays Prospect Count, Applicant Count, Admit Count, Confirm Count, and Enrollment Count data on the x-axis and total count data on the y-axis. |
The second Admissions Funnel graph displays Academic Career data on the x-axis and Prospect Count, Applicant Count, Admit Count, Confirm Count, and Enrollment Count data on the y-axis. |
The third Admissions Funnel graph displays Gender Code data on the x-axis and Prospect Count, Applicant Count, Admit Count, Confirm Count, and Enrollment Count data on the y-axis. |
|
View by Filter (Left) |
View by Filter (Right) |
|---|---|
|
Use this filter to view the second Admissions Funnel graph results by:
|
Use this filter to view the third Admissions Funnel graph results by:
|
The following table lists the columns and measures used in the Admissions Funnel report.
|
Report Column / Measure Name |
Report Column / Measure Origin |
|---|---|
|
Academic Career |
Academic Career (D_ACAD_CAR) Dimension |
|
Academic Load |
Academic Load (D_ACAD_LOAD) Dimension |
|
Academic Plan |
Academic Plan (D_ACAD_PLAN) Dimension |
|
Academic Program |
Academic Program (D_ACAD_PROG) Dimension |
|
Admit Term |
Admit Term (D_TERM) Dimension |
|
Admit Type |
Admit Type (D_ADMIT_TYPE) Dimension |
|
Application Center |
Application Center (D_APPL_CNTR) Dimension |
|
Ethnic Group |
Person (D_PERSON) Dimension |
|
Gender Code |
Person (D_PERSON) Dimension |
|
Institution |
Institution (D_INSTITUTION) Dimension |
|
Last School Attended |
External Organization (D_EXT_ORG) Dimension |
|
Official Residence |
Person Attribute (D_PERSON_ATTR) Dimension |
|
Recruiting Center |
Recruiting Center (D_RECRT_CNTR) Dimension |
|
Region |
Region (D_REGION_CS) Dimension |
|
Admit % |
IFNULL(100*"Fact Admission Funnel"."Admit Count"/("Fact Admission Funnel"."Applicant Count"), 0) |
|
Admit Count |
Admission Funnel (F_ADM_FUNNEL) Fact |
|
Applicant % |
IFNULL(100*"Fact Admission Funnel"."Applicant Count"/("Fact Admission Funnel"."Prospect Count"), 0) |
|
Applicant Count |
Admission Funnel (F_ADM_FUNNEL) Fact |
|
Confirm % |
IFNULL(100 * "Fact Admission Funnel"."Confirm Count"/("Fact Admission Funnel"."Admit Count"), 0) |
|
Confirm Count |
Admission Funnel (F_ADM_FUNNEL) Fact |
|
Enrollment % |
IFNULL(100 * "Fact Admission Funnel"."Enrollment Count"/("Fact Admission Funnel"."Confirm Count"), 0) |
|
Enrollment Count |
Admission Funnel (F_ADM_FUNNEL) Fact |
|
Prospect Count |
Admission Funnel (F_ADM_FUNNEL) Fact |
|
Yield % |
IFNULL(100 * "Fact Admission Funnel"."Enrollment Count"/("Fact Admission Funnel"."Admit Count"), 0) |