Recruiting Effectiveness Page
Use the Recruiting Effectiveness page to obtain an overview of your recruiting effectiveness and recruiting trends for your institution.
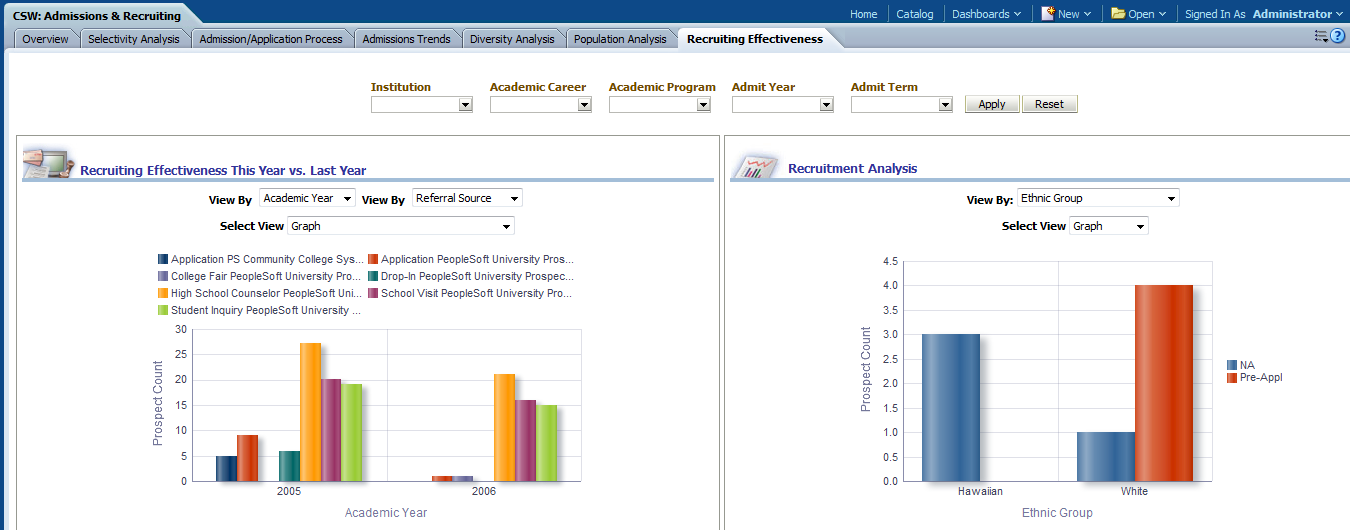
Image: Recruiting Effectiveness page
Recruiting Effectiveness page
|
Usage |
Reports |
Dashboard Prompt |
|---|---|---|
|
Provides you with an overview of your recruiting effectiveness and recruiting trends for your institution. |
This page is comprised of the following reports:
|
Use the Recruiting Effectiveness page prompt to filter page results by:
|
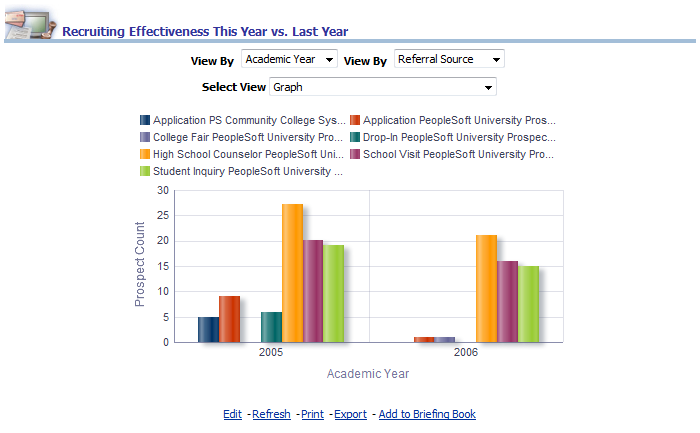
Recruiting Effectiveness This Year vs. Last Year Report
Access the Recruiting Effectiveness This Year vs. Last Year report, which enables you to review recruiting metric trends.
Image: Recruiting Effectiveness This Year vs. Last Year report
Recruiting Effectiveness This Year vs. Last Year report
|
X,Y Axis Data |
View By Filters |
Select View Filter |
|---|---|---|
|
The Recruiting Effectiveness This Year vs. Last Year graph displays Academic Year data on the x-axis and Prospect Count by Referral Source data on the y-axis. The x-axis can display Admit Term data, depending on your selection in the first View by filter. You can also group the y-axis prospect count value by any of the following dimensions, depending on your selection in the second View By filter:
Note: You can click on graph data to review drill down data for a particular admit term or academic year. |
Use these filters to filter the report results by:
|
Use this filter to:
|
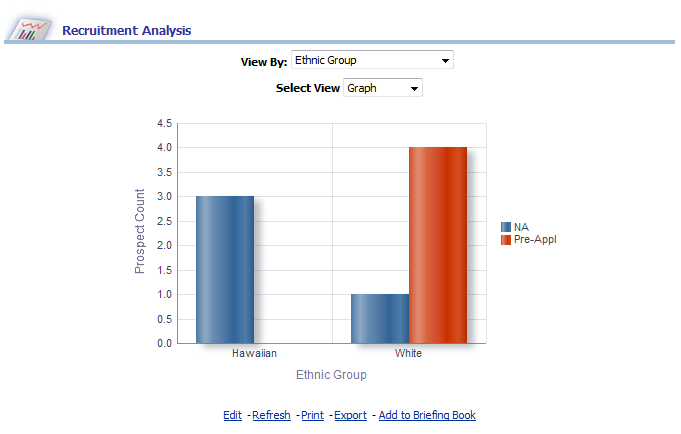
Recruitment Analysis Report
Access the Recruitment Analysis report, which provides insight into recruiting effectiveness and delivers details about recruiter prospects and applicants.
Image: Recruitment Analysis report
Recruitment Analysis report
|
X,Y Axis Data |
View By Filter |
Select View |
|---|---|---|
|
The Recruitment Analysis graph displays Recruiter Name data on the x-axis and Prospect Count data on the y-axis, with Ethnic Group data plotted across the x/y-axis. The x/y-axis can also plot any of the following dimensions, depending on your View By filter selection:
|
Use this filter to view the Recruitment Analysis report results by:
|
Use this filter to:
|
|
Report Column / Measure Name |
Report Column / Measure Origin |
|---|---|
|
Academic Career |
Academic Career (D_ACAD_CAR) Dimension |
|
Academic Program |
Academic Program (D_ACAD_PROG) Dimension |
|
Admit Term |
Admit Term (D_TERM) Dimension |
|
Admit Type |
Admit Type (D_ADMIT_TYPE) Dimension |
|
Ethnic Group |
Person (D_PERSON) Dimension |
|
Institution |
Institution (D_INSTITUTION) Dimension |
|
Last School Attended |
External Organization (D_EXT_ORG) Dimension |
|
Prospect State |
Person Address (D_PERSON_ADDR) Dimension |
|
Recruiter Name |
Prospect Recruiter (D_PRSPCT_RECRTR) Dimension |
|
Recruiting Status |
Recruiting Status (D_RECRT_STAT) Dimension |
|
Referral Source |
Referral Source (D_RFRL_SRC) Dimension |
|
Prospect Count |
Admission Funnel (F_ADM_FUNNEL) Fact |
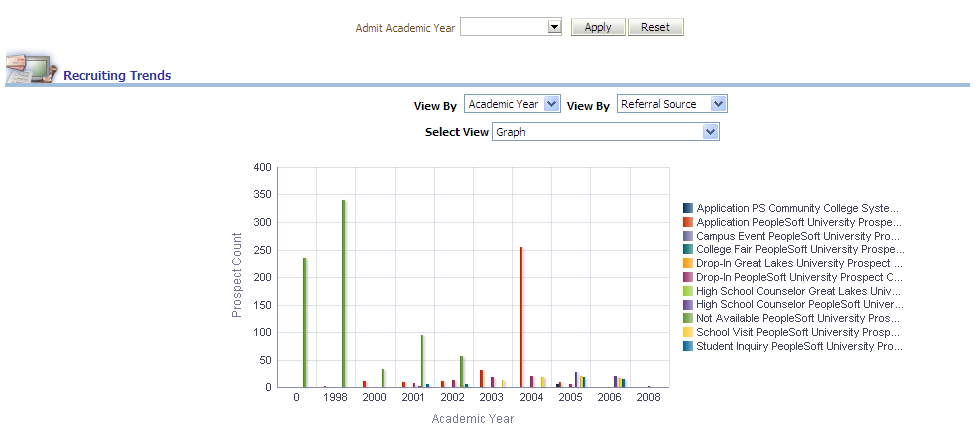
Recruiting Trends Report
Access the Recruiting Trends report, which provides insight into recruiting trends for your institution and delivers details about recruiting centers, referral sources, recruiting status, and so forth.
Image: Recruiting Trends report
Recruiting Trends report.
|
X,Y Axis Data |
View By Filters |
Select View Filter |
|---|---|---|
|
The Recruiting Trends graph displays Academic Year data on the x-axis and Prospect Count by Referral Source data on the y-axis. The x-axis can also display Admit Term data, depending on your selection in the first View by filter. You can also group the y-axis prospect count value by any of the following dimensions, depending on your selection in the second View By filter:
Note: You can click on graph data to review drill down data for a particular admit term or academic year. |
Use this filter to view the report results by:
|
Use this filter to:
|
|
Report Column Name |
Report Column Origin |
|---|---|
|
Academic Career |
Academic Career (D_ACAD_CAR) Dimension |
|
Admit Academic Year |
Admit Term (D_TERM) Dimension |
|
Admit Term |
Admit Term (D_TERM) Dimension |
|
Institution |
Institution (D_INSTITUTION) Dimension |
|
Recruiting Center |
Recruiting Center (D_RECRT_CNTR) Dimension |
|
Recruiting Status |
Recruiting Status (D_RECRT_STAT) Dimension |
|
Referral Source |
Referral Source (D_RFRL_SRC) Dimension |
|
Prospect Count |
Admission Funnel (F_ADM_FUNNEL) Fact |