Enrollment Analysis Page
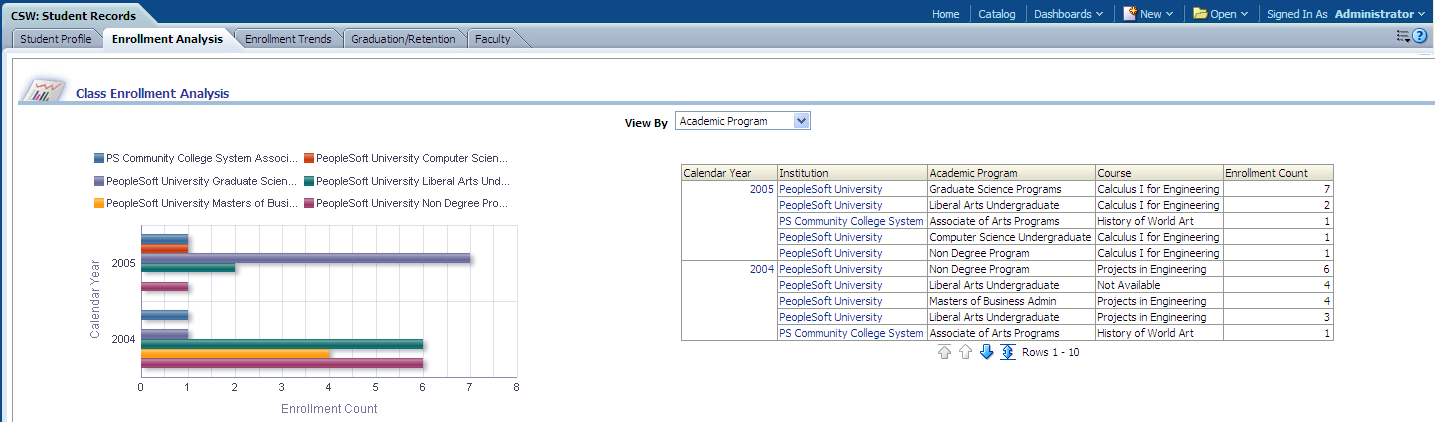
Use the Enrollment Analysis page to obtain an overview of course enrollment and capacity, student enrollment trends by semester, and top academic performance.
Image: Enrollment Analysis page
Enrollment Analysis page
|
Usage |
Reports |
|---|---|
|
Provides you with overview of course enrollment and capacity, student enrollment trends by semester, and top academic performance. |
This page is comprised of the following reports:
|
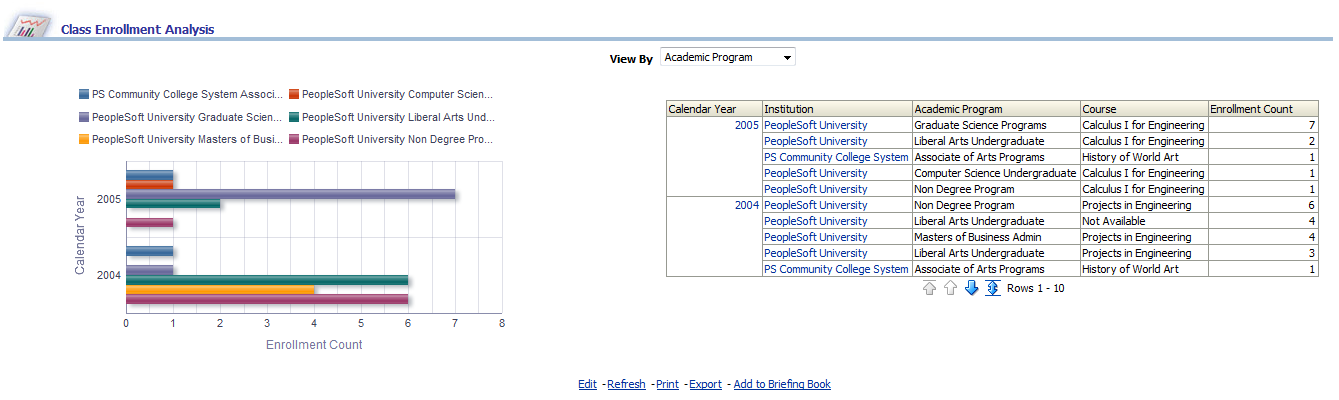
Class Enrollment Analysis Report
Use the Class Enrollment Analysis report, which enables you to analyze class enrollment counts by calendar year.
Image: Class Enrollment Analysis report
Class Enrollment Analysis report
|
X,Y Axis Data |
View By Filter |
|---|---|
|
The Class Enrollment Analysis bar chart displays Enrollment Count by Academic Program data on the x-axis and Calendar Year data on the y-axis. You can also group the x-axis enrollment count value by any of the following dimensions, depending on your selection in the second View By filter:
Note: You can click on graph data to review drill down data for a particular year and program. |
Use this filter to view report results by:
|
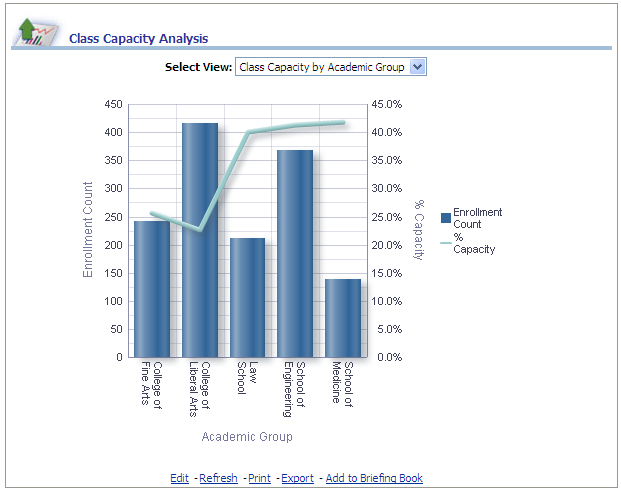
Class Capacity Analysis Report
Access the Class Capacity Analysis report, which enables you to measure student enrollment count and percent capacity by academic group and college of study.
Image: Class Capacity Analysis report
Class Capacity Analysis report
|
X,Y Axis Graph Data |
View By Filter |
|---|---|
|
The Class Capacity Analysis graph displays academic group data on the x-axis and enrollment count and percent capacity data on the y-axis. The x-axis can also plot any of the following dimensions, depending on the Select View filter selection:
|
Use this filter to view the Class Capacity Analysis report results by:
|
The following table lists the columns and measures used in the Class Capacity Analysis report.
|
Report Column / Measure Name |
Report Column / Measure Origin |
|---|---|
|
Institution |
Course Attributes (D_CRSE) Dimension |
|
Academic Group |
Course Attributes (D_CRSE) Dimension |
|
Subject Description |
Course Attributes (D_CRSE) Dimension |
|
Course Method |
Course Attributes (D_CRSE) Dimension |
|
Course Description |
Course Attributes (D_CRSE) Dimension |
|
Enrollment Count |
Term Enrollment (F_TERM_ENRLMT) Fact |
|
Class Capacity |
Term Enrollment (F_TERM_ENRLMT) Fact |
|
% Capacity |
Term Enrollment (F_TERM_ENRLMT) Fact |
Faculty Workload Detail Report (Class Capacity Analysis Report Drilldown)
Access the Faculty Workload Detail report by clicking on the Class Capacity Analysis report’s enrollment count value. This report displays the weekly workload in hours, load percentage and assignment percentage for each faculty member.
Note: The report header incorrectly displays: Faculty Workload Summary. This issue will be fixed in a future release.
Image: Faculty Workload Detail report
Faculty Workload Detail report
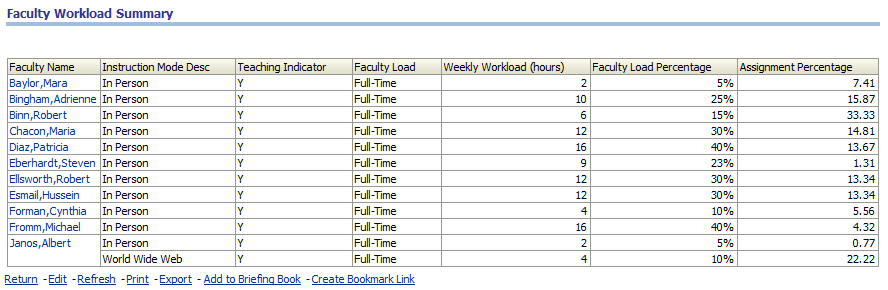
You can click any of the faculty names to access the Instructor Class Detail report for the selected faculty member. The Instructor Class Detail report is documented later in this section.
The following table lists the columns and measures used in the Faculty Workload Detail report.
|
Report Column / Measure Name |
Report Column / Measure Origin |
|---|---|
|
Faculty Name |
Person (D_PERSON) Dimension |
|
Course Description |
Course (D_CRSE) Dimension |
|
Term Description |
Term (D_TERM) Dimension |
|
Start Day Date |
Day (D_DAY) Dimension |
|
End Day Date |
Day (D_DAY) Dimension |
|
Session Description |
Session (D_SESSION) Dimension |
|
Week Workload Hour Count |
Class Instructor (F_CLASS_INSTRCT) Fact |
Student Enrollment by Semester Report
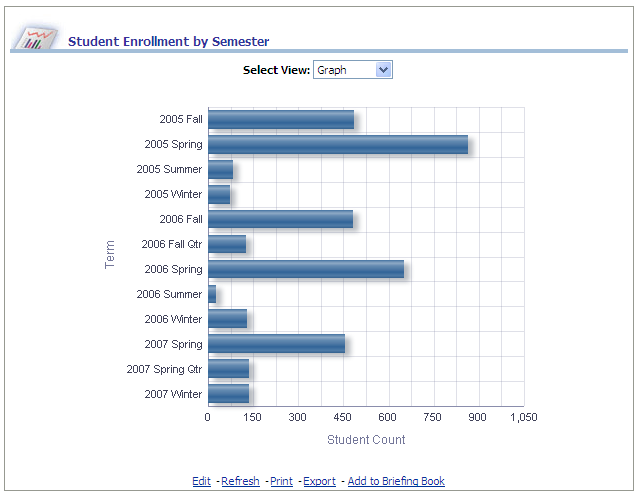
Access the Student Enrollment by Semester report, which enables you to measure students enrolled by semester.
Image: Student Enrollment by Semester report
Student Enrollment by Semester report
|
X,Y Axis Graph Data |
Select View Filter |
|---|---|
|
The Student Enrollment by Semester graph displays student count data on the x-axis and semester (term) data on the y-axis. |
Use this filter to view the Student Enrollment by Semester report results by:
|
The following table lists the columns and measures used in the Student Enrollment by Semester report.
|
Report Column / Measure Name |
Report Column / Measure Origin |
|---|---|
|
Term |
Term (D_TERM) Dimension |
|
Academic Group |
Academic Program (D_ACAD_PROG) Dimension |
|
Academic Career |
Academic Program (D_ACAD_PROG) Dimension |
|
Academic Program |
Academic Program (D_ACAD_PROG) Dimension |
|
Academic Plan |
Academic Plan (D_ACAD_PLAN) Dimension |
|
Academic Plan Type |
Academic Plan (D_ACAD_PLAN) Dimension |
|
Academic Load |
Academic Load (D_ACAD_LOAD) Dimension |
|
Student Count |
Term Enrollment (F_TERM_ENRLMT) Fact |
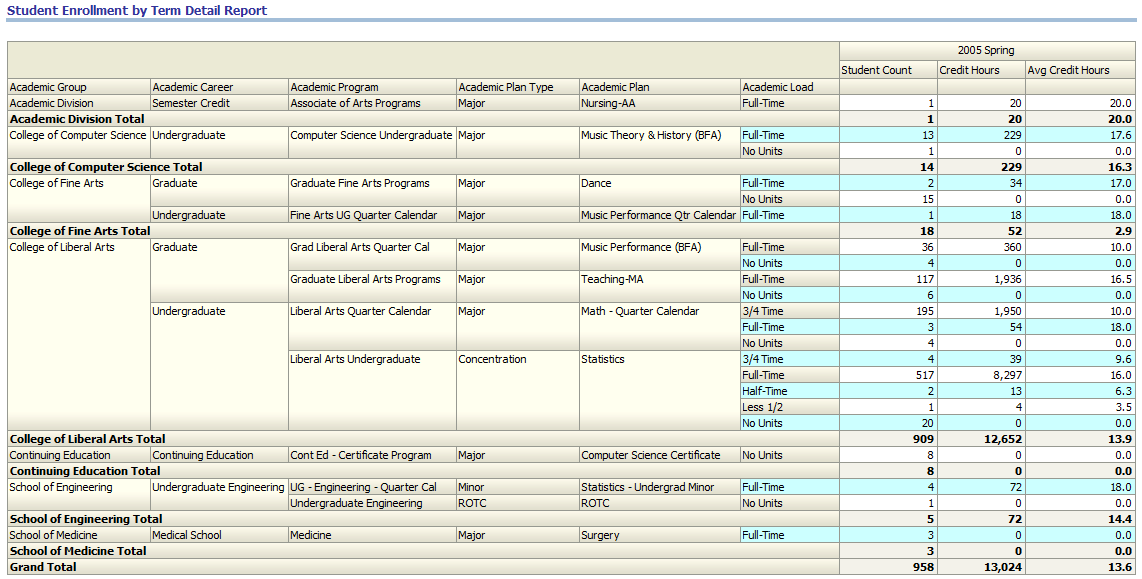
Student Enrollment by Term Detail Report (Student Enrollment by Semester Report Drilldown)
Access the Student Enrollment by Term Detail report by clicking on the Student Enrollment by Semester report’s student count value. This report displays the number of enrolled student's credit hours by a combination of academic dimension values.
Image: Student Enrollment by Term Detail report
Student Enrollment by Term Detail report
The following table lists the columns and measures used in the Student Enrollment by Term Detail report.
|
Report Column / Measure Name |
Report Column / Measure Origin |
|---|---|
|
Term Description |
Term (D_TERM) Dimension |
|
Academic Group |
Academic Program (D_ACAD_PROG) Dimension |
|
Academic Career |
Academic Program (D_ACAD_PROG) Dimension |
|
Academic Program |
Academic Program (D_ACAD_PROG) Dimension |
|
Academic Plan |
Academic Plan (D_ACAD_PLAN) Dimension |
|
Academic Plan Type |
Academic Plan (D_ACAD_PLAN) Dimension |
|
Academic Load |
Academic Load (D_ACAD_LOAD) Dimension |
|
Student Count |
Term Enrollment (F_TERM_ENRLMT) Fact |
|
Credit Hours (Units Taken in Progress) |
Term Enrollment (F_TERM_ENRLMT) Fact |
|
Avg (average) Credit Hours |
Term Enrollment (F_TERM_ENRLMT) Fact: Units Taken in Progress / Row Count |
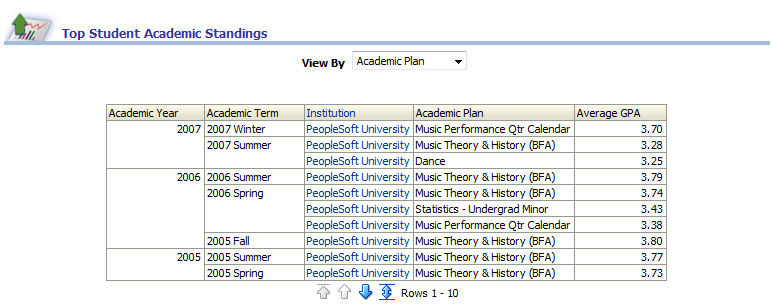
Top Student Academic Standings Report
Access the Top Student Academic Standings report, which enables you to analyze average GPA for a given academic year, academic term, institution, and academic plan.
Image: Top Student Academic Standings report
Top Student Academic Standings report
|
Academic Year Filter |
View By Filter |
|---|---|
|
Use this filter to refine the report results to a specific academic year. |
Use this filter to view report results by:
|