Enrollment Trends Page
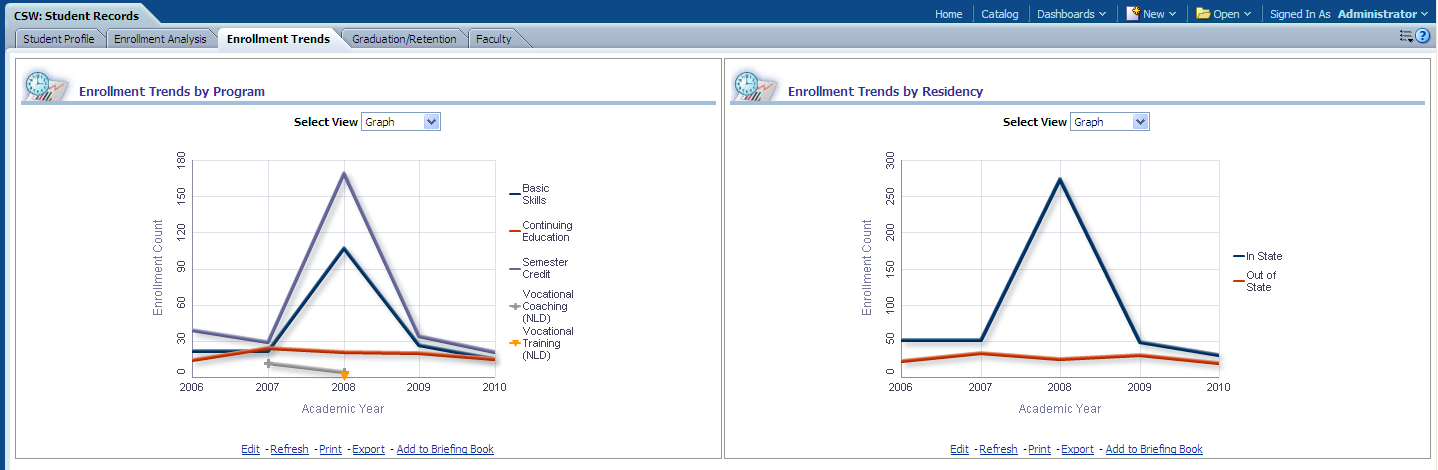
Use the Enrollment Trends page to obtain an overview of student enrollment trends in specific programs and by residency over multiple academic years.
Image: Enrollment Trends page
Enrollment Trends page
|
Usage |
Reports |
|---|---|
|
Provides you with overview of student enrollment trends in specific programs and by residency over multiple academic years. |
This page is comprised of the following reports:
|
Enrollment Trends by Program Report
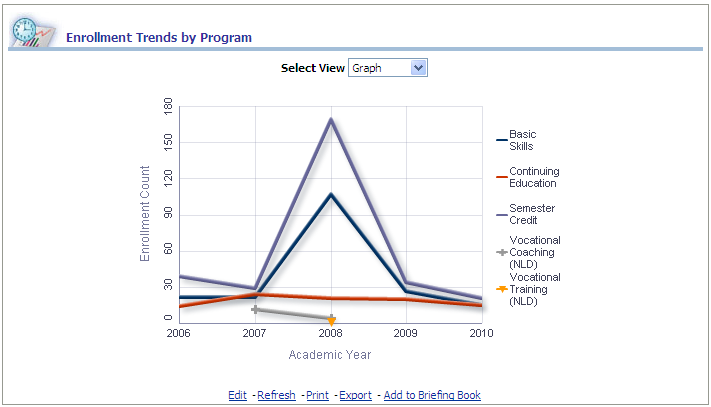
Access the Enrollment Trends by Program report, which enables you to measure student enrollment count by program over multiple academic years.
Image: Enrollment Trends by Program report
Enrollment Trends by Program report
|
X,Y Axis Graph Data |
View By Filter |
|---|---|
|
The Enrollment Trends by Program graph displays academic year data on the x-axis and enrollment count and academic program data on the y-axis. |
Use this filter to view the Enrollment Trends by Program report results by:
|
The following table lists the columns and measures used in the Enrollment Trends by Program report.
|
Report Column / Measure Name |
Report Column / Measure Origin |
|---|---|
|
Academic Year |
Term (D_TERM) Dimension |
|
College |
Institution (D_INSTITUTION) Dimension |
|
Academic Career |
Academic Career (D_ACAD_CAR) Dimension |
|
Academic Level |
Academic Level (D_ACAD_LVL) Dimension |
|
Academic Program |
Academic Program (D_ACAD_PROG) Dimension |
|
Admit Type |
Academic Plan (D_ACAD_PLAN) Dimension |
|
Campus |
Campus (D_CAMPUS) Dimension |
|
Residency |
Residency (D_RSDNCY) Dimension |
|
Enrollment Count (Units Taken in Progress) |
Term Enrollment (F_TERM_ENRLMT) Fact |
|
% of Academic Year Total |
Term Enrollment (F_TERM_ENRLMT) Fact |
Enrollment Trends by Residency Report
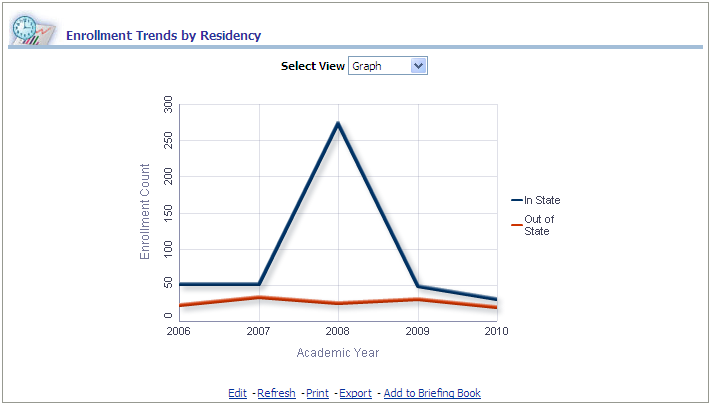
Access the Enrollment Trends by Residency report, which enables you to measure student enrollment count by residency over multiple academic years.
Image: Enrollment Trends by Residency report
Enrollment Trends by Residency report
|
X,Y Axis Graph Data |
View By Filter |
|---|---|
|
The Enrollment Trends by Residency graph displays academic year data on the x-axis and student enrollment count and residency data on the y-axis. |
Use this filter to view the Enrollment Trends by Residency report results by:
|
The following table lists the columns and measures used in the Enrollment Trends by Residency report.
|
Report Column / Measure Name |
Report Column / Measure Origin |
|---|---|
|
Academic Group |
Academic Group |
|
Academic Level |
Academic Level |
|
Academic Load |
Academic Load |
|
Residency |
Residency |
|
Row Count |
Row Count |