Actual vs Prior-Budget-Forecast Page
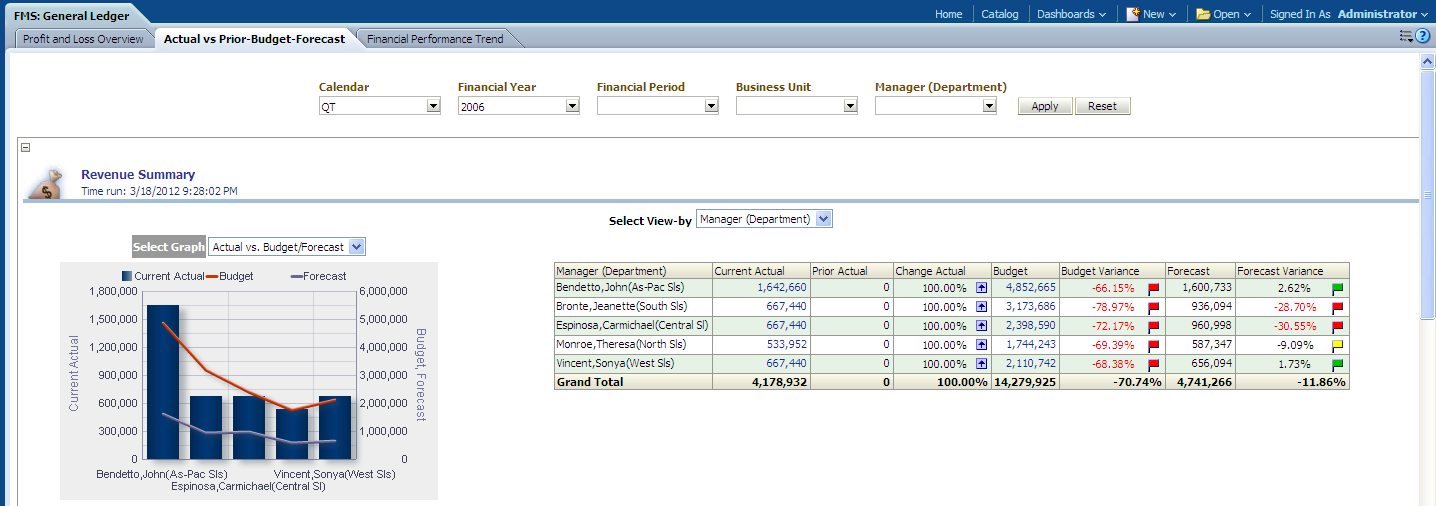
Use the Actual vs Prior-Budget-Forecast page (Dashboards, FMS Reports, FMS: General Ledger, Actual vs Prior-Budget-Forecast).
Image: Actual vs Prior-Budget-Forecast page
This example illustrates the fields and controls on the Actual vs Prior-Budget-Forecast page. You can find definitions for the fields and controls later on this page.
|
Usage |
Reports |
Dashboard Prompt |
|---|---|---|
|
Provides you with a detailed analysis of revenue, expense, and cost of goods sold metrics for your organization. |
This page is comprised of the following reports:
|
Use the Actual vs Prior-Budget-Forecast page prompt to filter page results by:
|
Revenue Summary Report
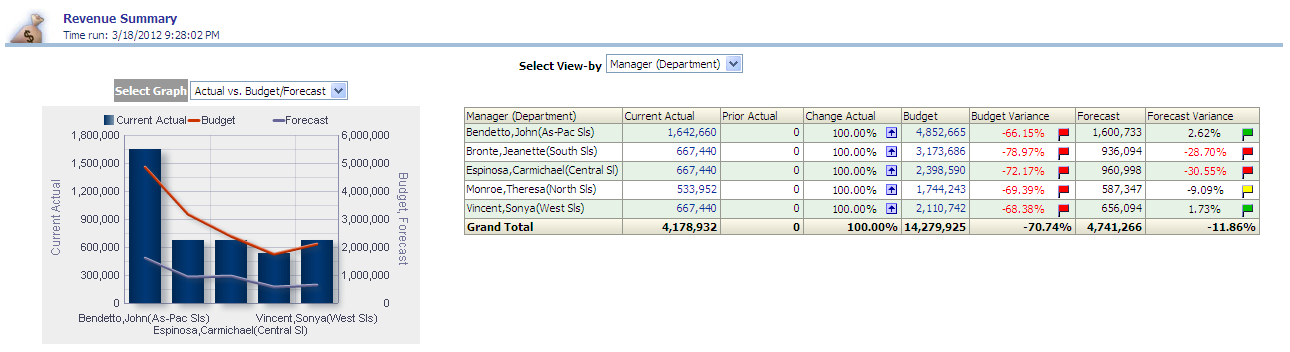
Use the Revenue Summary report, which enables you to analyze revenue by business unit, department, and account as well as comparing actual to budget revenue amounts.
Image: Revenue Summary report
This example illustrates the fields and controls on the Revenue Summary report. You can find definitions for the fields and controls later on this page.
|
Select Graph - Actual vs. Budget/Forecast (Default) |
Select Graph - Revenue Contribution |
|---|---|
|
The Actual vs. Budget/Forecast graph displays Manager (Department) data on the x-axis and Current Actual (revenue) and Budget, Forecast (revenue) data on the y-axis. |
The Revenue Contribution pie chart displays revenue data grouped by Manager (Department). |
|
Select Graph - Variance Analysis |
Select View By |
|---|---|
|
The Variance Analysis line graph displays Manager (Department) data on the x-axis and (Revenue) Variance Percentage data on the y-axis. |
Use this filter to view results in the table by:
|
COGS (Cost of Goods Sold) Summary Report
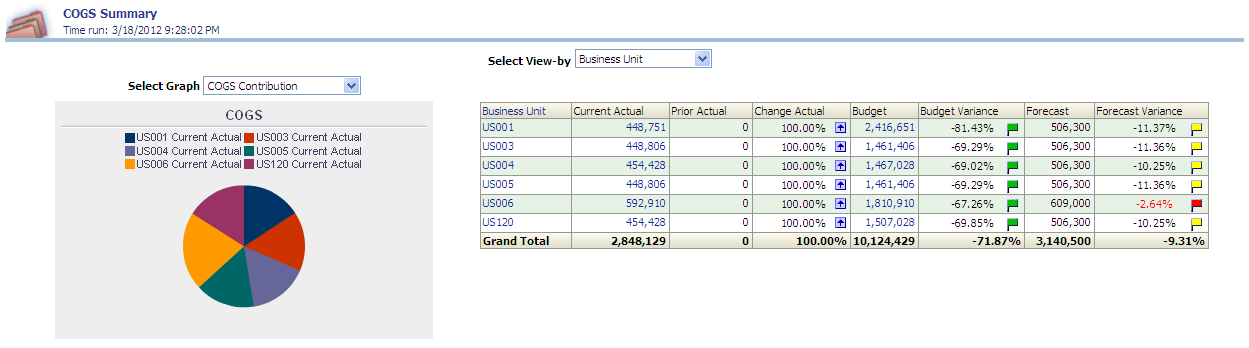
Use the COGS (Cost of Goods Sold) Summary report, which summarizes cost of goods sold by business unit, department, and account as well as comparing actual to budget amounts.
Image: COGS (Cost of Goods Sold) Summary report
This example illustrates the fields and controls on the COGS (Cost of Goods Sold) Summary report. You can find definitions for the fields and controls later on this page.
|
Select Graph - COGS Contribution (Default) |
Select Graph - Actual vs. Budget/Forecast |
|---|---|
|
The COGS Contribution pie chart displays cost of goods sold data grouped by Business Unit. |
The Actual vs. Budget/Forecast graph displays Business Unit data on the x-axis and Current Actual (COGS) and Budget, Forecast (COGS) data on the y-axis. |
|
Select Graph - Variance Analysis |
Select View By |
|---|---|
|
The Variance Analysis line graph displays Business Unit data on the x-axis and COGS Variance Percentage data on the y-axis. |
Use this filter to view results in the table by:
|
Expense Summary Report
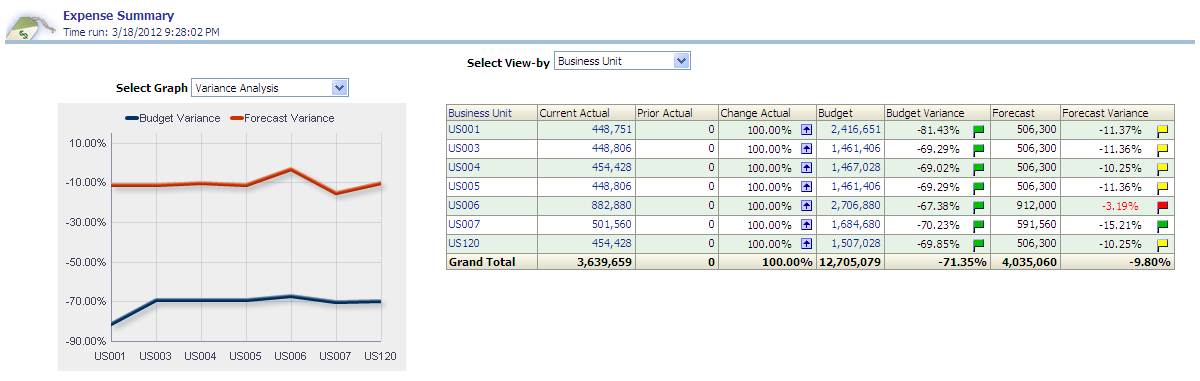
Use the Expense Summary report, which summarizes expenses by business unit, department, and account as well as comparing actual to budget expense amounts.
Image: Expense Summary report
This example illustrates the fields and controls on the Expense Summary report. You can find definitions for the fields and controls later on this page.
|
Select Graph - Variance Analysis |
Select Graph - Expense Contribution (Default) |
|---|---|
|
The Variance Analysis line graph displays Business Unit data on the x-axis and Expense Variance Percentage data on the y-axis. |
The Expense Contribution pie chart displays expense data grouped by Business Unit. |
|
Select Graph - Actual vs. Budget/Forecast |
Select View By Filter |
|---|---|
|
The Actual vs. Budget/Forecast graph displays Business Unit data on the x-axis and Current Actual (expense) and Budget, Forecast (expense) data on the y-axis. |
Use this filter to view results in the table by:
|