Financial Performance Trend Page
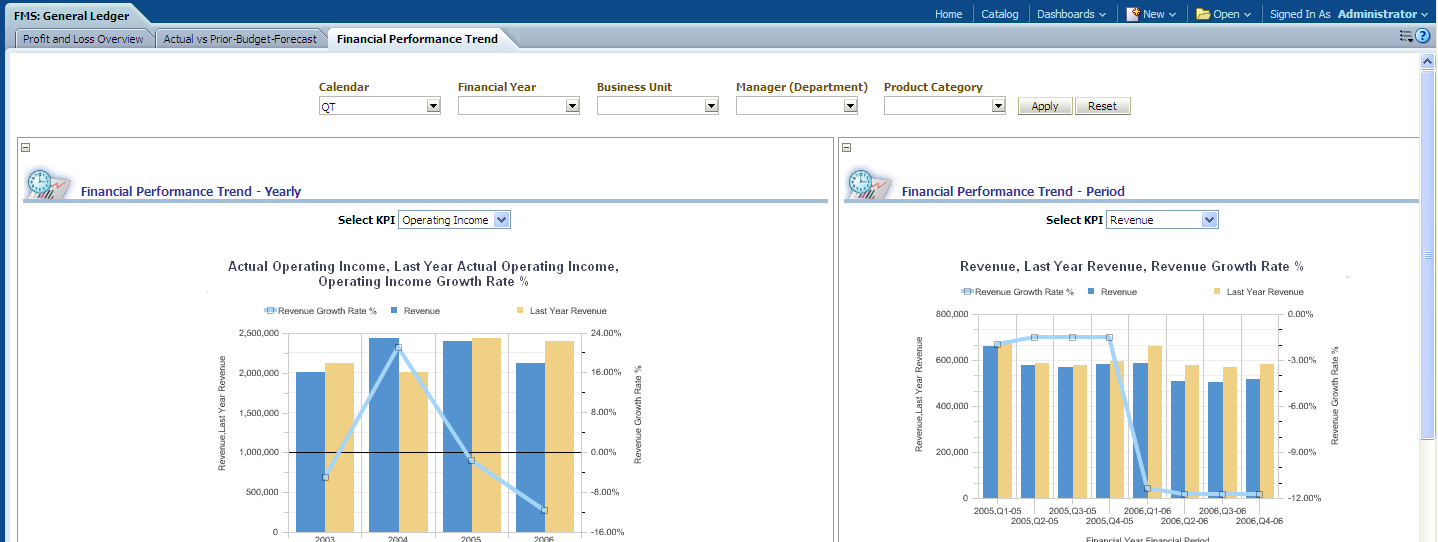
Use the Financial Performance Trend page to find the overview of your organization's financial performance trend, by year and period..
Image: Financial Performance Trend page
This example illustrates the fields and controls on the Financial Performance Trend page. You can find definitions for the fields and controls later on this page.
|
Usage |
Reports |
Dashboard Prompt |
|---|---|---|
|
Provides you with an overview of your organization's financial performance trend, by year and period. |
This page is comprised of the following reports:
|
Use the Financial Performance Trend page prompt to filter page results by:
|
Financial Performance Trend - Yearly Report
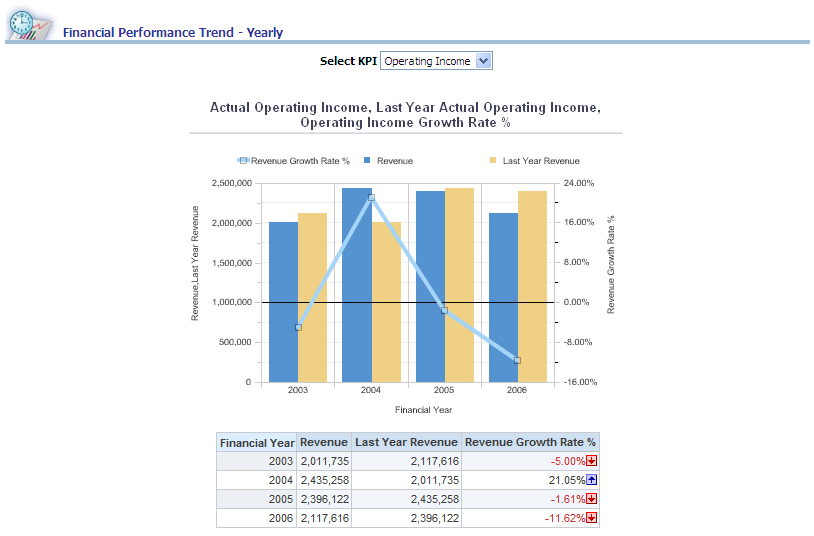
Use the Financial Performance Trend - Yearly report, which enables you to analyze financial performance trends by year.
Image: Financial Performance Trend - Yearly report
This example illustrates the fields and controls on the Financial Performance Trend - Yearly report. You can find definitions for the fields and controls later on this page.
Financial Performance Trend - Yearly report
|
Select KPI - Revenue |
Select KPI - Expenses |
|---|---|
|
The KPI - Revenue graph displays Financial Year data on the x-axis and Revenue, Last Year Revenue and Revenue Growth Rate % data on the y-axis. |
The KPI - Expenses graph displays Financial Year data on the x-axis and Expenses, Last Year Expenses and Expense Growth Rate % data on the y-axis. |
|
Select KPI - COGS |
Select KPI - Operating Income |
|---|---|
|
The KPI - COGS graph displays Financial Year data on the x-axis and COGS Actual Amount, Last Year COGS Actual Amount and COGS Growth Rate % data on the y-axis. |
The KPI - Operating Income graph displays Financial Year data on the x-axis and Operating Income Actual Amount, Last Year Operating Income Actual Amount and Operating Income Growth Rate % data on the y-axis. |
Financial Performance Trend - Period Report
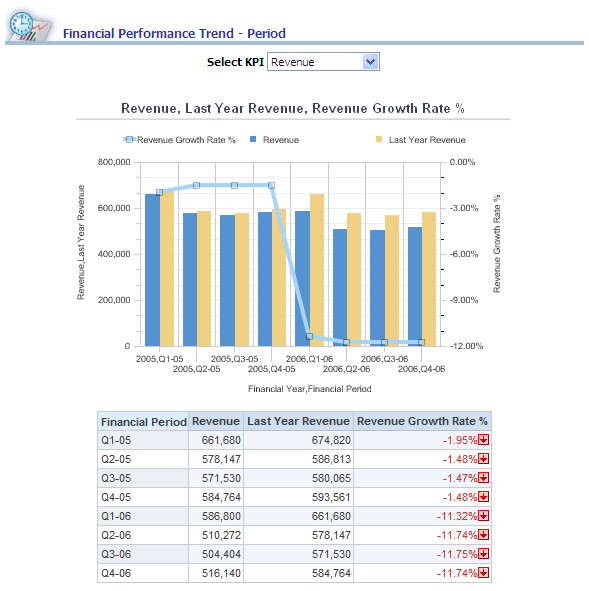
Use the Financial Performance Trend - Period report, which enables you to analyze financial performance trends by period.
Image: Financial Performance Trend - Period report
This example illustrates the fields and controls on the Financial Performance Trend - Period report. You can find definitions for the fields and controls later on this page.
|
Select KPI - Revenue |
Select KPI - Expenses |
|---|---|
|
The KPI - Revenue graph displays Financial Year, Period data on the x-axis and Revenue, Last Year Revenue and Revenue Growth Rate % data on the y-axis. |
The KPI - Expenses graph displays Financial Year, Period data on the x-axis and Expenses, Last Year Expenses and Expense Growth Rate % data on the y-axis. |
|
Select KPI - COGS |
Select KPI - Operating Income |
|---|---|
|
The KPI - COGS graph displays Financial Year, Period data on the x-axis and COGS Actual Amount, Last Year COGS Actual Amount and COGS Growth Rate % data on the y-axis. |
The KPI - Operating Income graph displays Financial Year, Period data on the x-axis and Operating Income Actual Amount, Last Year Operating Income Actual Amount and Operating Income Growth Rate % data on the y-axis. |