Profit and Loss Overview Page
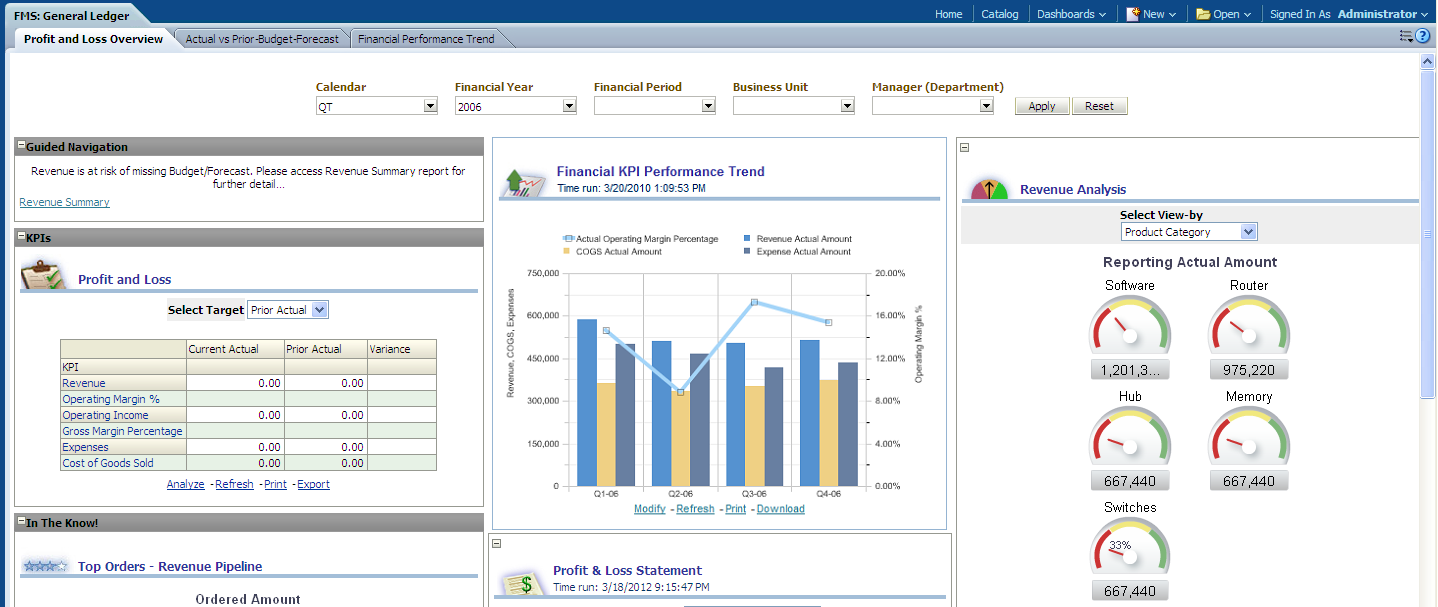
Use the Profit and Loss Overview page to provide an analysis of general ledger financial metrics referencing the GL & Profitability data mart.
Image: Profit and Loss Overview page
This example illustrates the fields and controls on the Profit and Loss Overview page. You can find definitions for the fields and controls later on this page.
|
Usage |
Reports |
Dashboard Prompt |
|---|---|---|
|
Provides an analysis of general ledger financial metrics referencing the GL & Profitability data mart. Metrics include revenue, profit & loss, and financial KPI's. |
This page is comprised of the following reports:
|
Use the Profit and Loss Overview page prompt to filter page results by:
|
KPIs - Profit and Loss Report
Use the KPIs - Profit and Loss report, which enables you to analyze Operating Margin %, Operating Income, Gross Margin %, Expenses and Cost of Goods Sold.
Image: KPIs - Profit and Loss report
This example illustrates the fields and controls on the KPIs - Profit and Loss report. You can find definitions for the fields and controls later on this page.
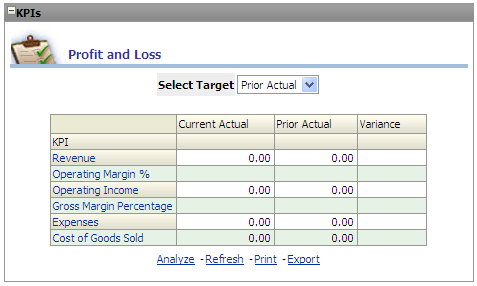
Use the Select Target filter to filter the report results by:
Budget
Forecast
Prior Actual (default)
Financial KPI Performance Trend Report
Use the Financial KPI Performance Trend report, which enables you to analyze financial performance trends such as operating margin %, Revenue, Expense and Cost of Goods Sold amounts.
Image: Financial KPI Performance Trend report
This example illustrates the fields and controls on the Financial KPI Performance Trend report. You can find definitions for the fields and controls later on this page.
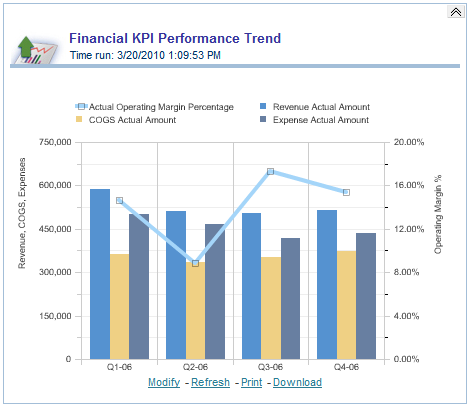
The Financial KPI Performance Trend line graph displays Quarterly data on the x-axis and Revenue, COGS, Expenses, or alternatively, Operating Margin Percent data on the y-axis.
Revenue Analysis Report
Use the Revenue Analysis report, which enables you to analyze revenue amount by product, business unit, department, project and period.
Image: Revenue Analysis report
This example illustrates the fields and controls on the Revenue Analysis report. You can find definitions for the fields and controls later on this page.
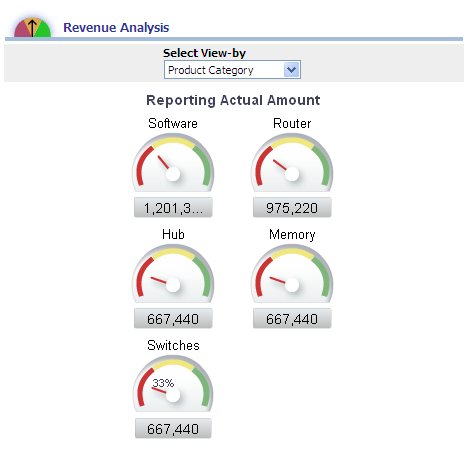
Use the Select View By filter to view report results by:
Business Unit
Manager (Department)
Product Category (default)
Project
Period
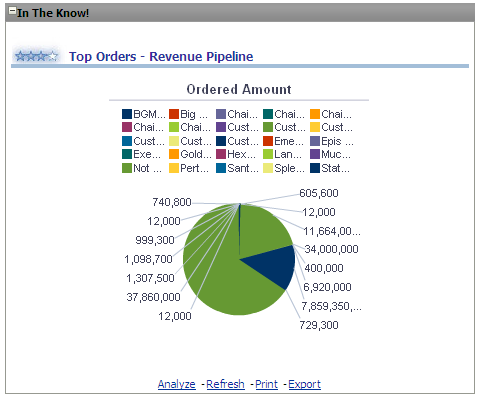
Top Orders - Revenue Pipeline Report
Use the Top Orders - Revenue Pipeline report, which enables you to analyze revenue metrics by customer.
Image: Top Orders - Revenue Pipeline report
This example illustrates the fields and controls on the Top Orders - Revenue Pipeline report. You can find definitions for the fields and controls later on this page.
Profit & Loss Statement Report
Use the Profit & Loss Statement report, which enables you to analyze profit and loss metrics by business unit, department, product, and so forth.
Image: Profit & Loss Statement report
This example illustrates the fields and controls on the Profit & Loss Statement report. You can find definitions for the fields and controls later on this page.
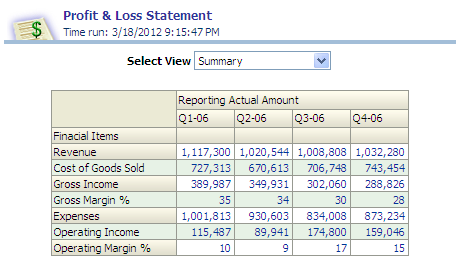
Use the Select View filter to view report results by:
Business Unit
Manager (Department)
Product Category
Summary (default)