NCI (National Cancer Institute) Page
Use the NCI (National Cancer Institute) page to provide you with an overview of NCI (National Cancer Institute) grant awards for your institution
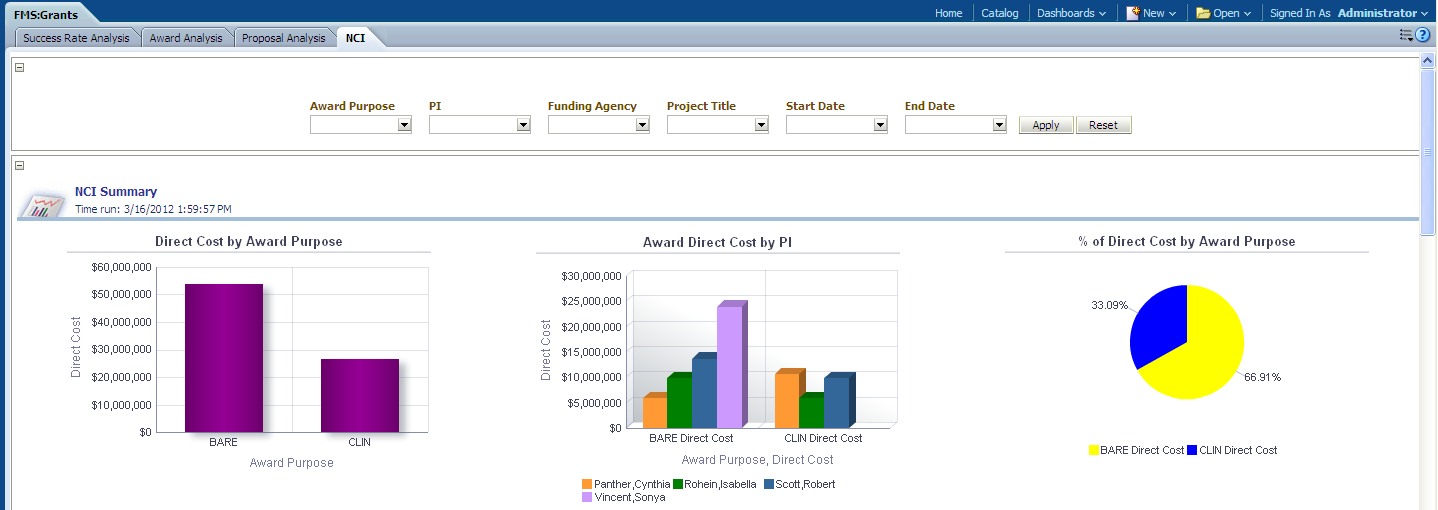
Image: NCI page
This example illustrates the fields and controls on the NCI page. You can find definitions for the fields and controls later on this page.
|
Usage |
Reports |
Dashboard Prompt |
|---|---|---|
|
Provides you with an overview of NCI (National Cancer Institute) grant awards for your institution. |
This page contains the NCI Summary report. |
Use the NCI page prompt to filter page results by:
|
NCI (National Cancer Institute) Summary Report
Use the NCI (National Cancer Institute) Summary report, which provides an overview of grant award for the National Cancer Institute and enables you to analyze direct cost by award purpose and award cost by principal investigator and award purpose.
Image: NCI Summary report, part 1
This example illustrates the fields and controls on the NCI Summary report, part 1. You can find definitions for the fields and controls later on this page.
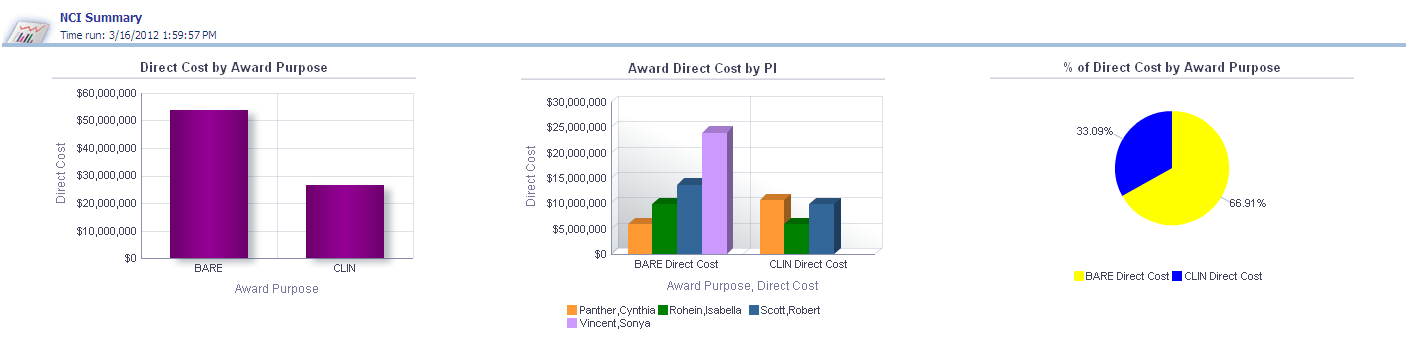
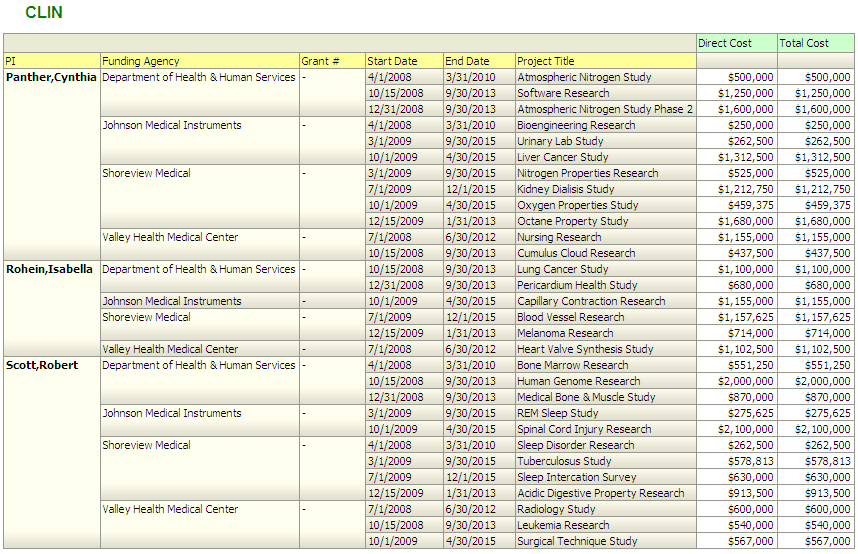
Image: NCI Summary report, part 2
This example illustrates the fields and controls on the NCI Summary report, part 2. You can find definitions for the fields and controls later on this page.
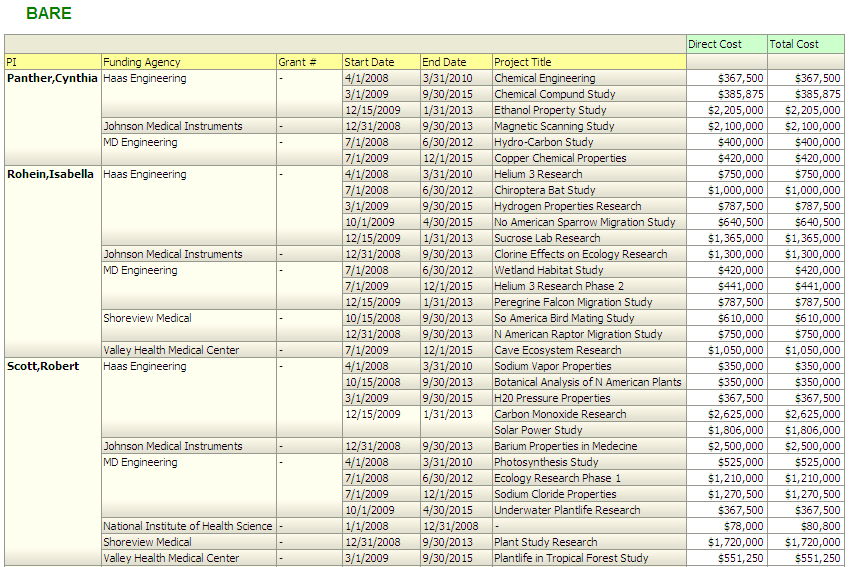
Image: NCI Summary report, part 3
This example illustrates the fields and controls on the NCI Summary report, part 3. You can find definitions for the fields and controls later on this page.
|
X,Y Axis Data Direct Cost by Award Purpose |
X,Y Axis Data Award Direct Cost by Principal Investigator |
Pie Chart Data % of Direct Cost by Award Purpose |
|---|---|---|
|
The Direct Cost by Award Purpose graph displays Award Purpose data on the x-axis and Direct Cost data on the y-axis. Note: Additional information about award purposes can be found in the grids below this graph. |
The Award Direct Cost by Principal Investigator graph displays Award Purpose and Principal Investigator data on the x-axis and Direct Cost data on the y-axis. Note: Additional information about award purposes can be found in the grids below this graph. |
The % of Direct Cost by Award Purpose pie chart displays % of Direct Cost data grouped by Award Purpose. |
|
Report Column / Measure Name |
Report Column / Measure Origin |
|---|---|
|
Award Purpose |
Award Attribute (D_GM_ATTR_CODE) Dimension |
|
Principal Investigator |
Grants Management Principal Investigator (D_GM_PI) Dimension |
|
Funding Agency |
Sponsor (D_GM_SPONSOR) Dimension |
|
Grant Number |
Grants Management Award (D_GM_AWARD) Dimension |
|
Project Title |
Grants Management Project (D_GM_PRJ) Dimension |
|
Start Date |
Day (D_DAY) Dimension |
|
End Date |
Day (D_DAY) Dimension |
|
Direct Cost |
Grants Award (F_GM_AWARD) Fact |
|
Total Cost |
Grants Award (F_GM_AWARD) Fact |
|
% of Direct Cost by Award Purpose |
"Fact Grants Management Award"."Total Award Amount" |