Proposal Analysis Page
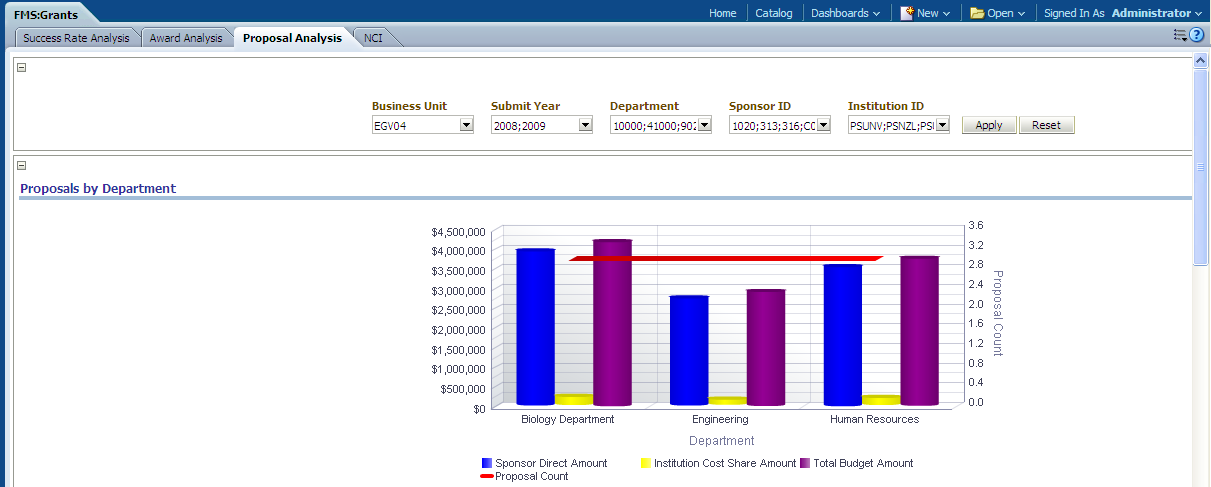
Use the Proposal Analysis page to provide you with an overview of proposal trends, submitted proposals, and outstanding proposals.
Image: Proposal Analysis page
This example illustrates the fields and controls on the Proposal Analysis page. You can find definitions for the fields and controls later on this page.
|
Usage |
Reports |
Dashboard Prompt |
|---|---|---|
|
Provides you with an overview of proposal trends, submitted proposals, and outstanding proposals. |
This page is comprised of the following reports:
|
Use the Proposal Analysis page prompt to filter page results by:
|
Proposals by Department Report
Use the Proposals by Department report, which enables you to analyze proposals by department.
Image: Proposals by Department report
This example illustrates the fields and controls on the Proposals by Department report. You can find definitions for the fields and controls later on this page.
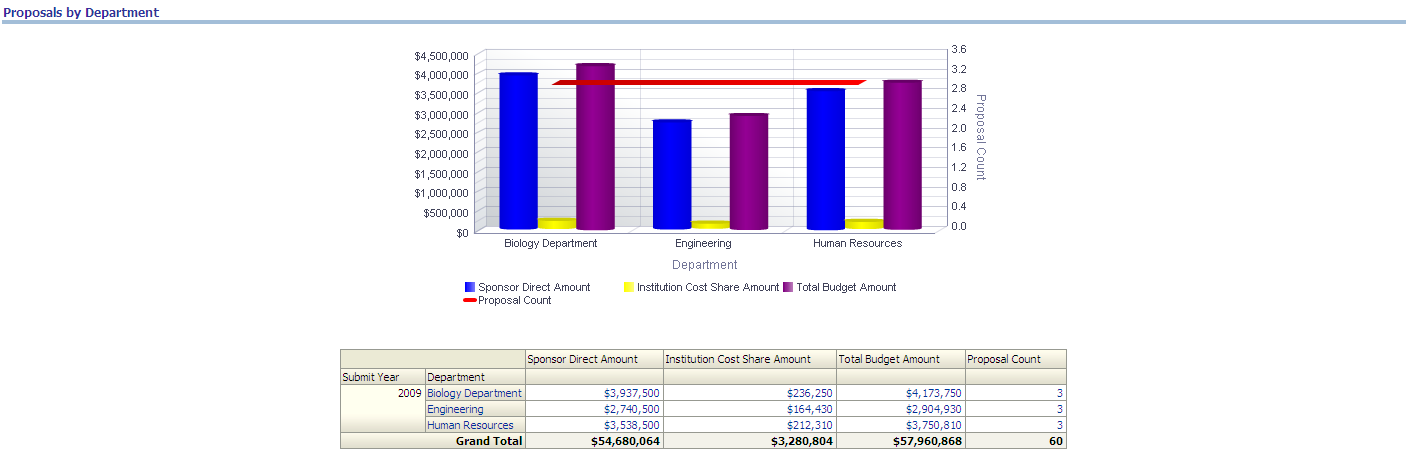
The Proposals by Department graph displays Department data on the x-axis and Sponsor Direct Amount, Institution Cost Share Amount, and Total Budget Amount data on the y-axis, with Proposal Count data plotted across the x/y-axis.
|
Report Column / Measure Name |
Report Column / Measure Origin |
|---|---|
|
(Proposal) Submit Year (Fiscal Year) |
Day (D_DAY) Dimension |
|
Department |
Department (D_DEPT) Dimension |
|
Sponsor Direct Amount |
Proposal Award Summary (F_GM_PRP_AWD) Fact |
|
Institution Cost Share Amount |
Proposal Award Summary (F_GM_PRP_AWD) Fact |
|
Total Budget Amount |
Proposal Award Summary (F_GM_PRP_AWD) Fact |
|
Proposal Count |
Proposal Award Summary (F_GM_PRP_AWD) Fact |
Outstanding Proposals Report
Use the Outstanding Proposals report, which enables you to identify and analyze proposals that are flagged as outstanding.
Image: Outstanding Proposals report
This example illustrates the fields and controls on the Outstanding Proposals report. You can find definitions for the fields and controls later on this page.
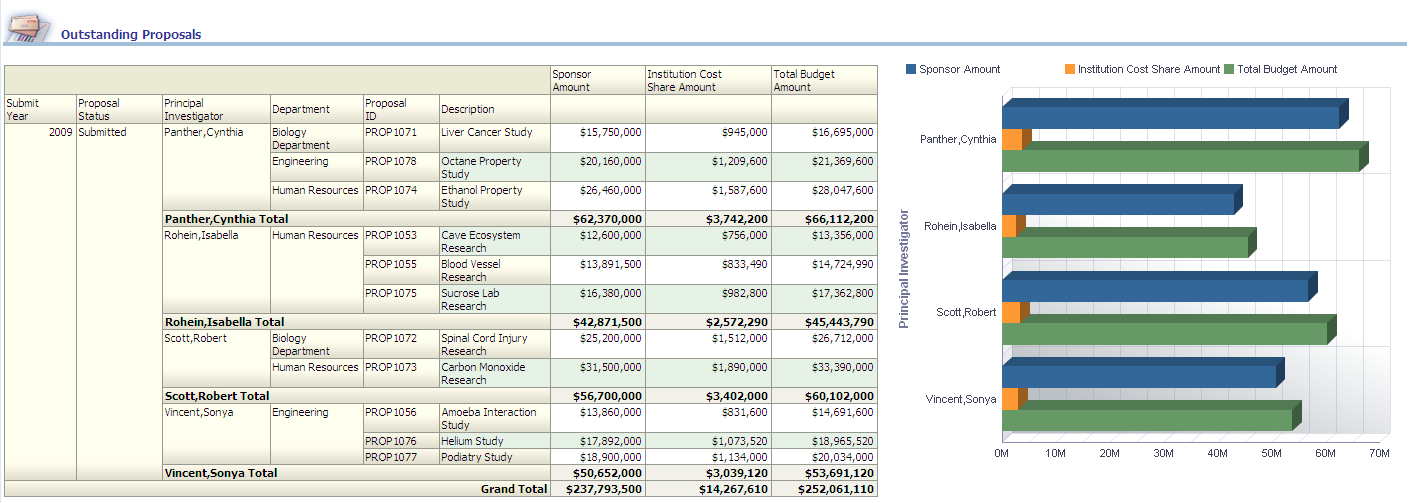
The Outstanding Proposals graph displays Sponsor Amount, Institution Cost Share Amount, and Total Budget Amount data on the x-axis and Principal Investigator data on the y-axis.
|
Report Column / Measure Name |
Report Column / Measure Origin |
|---|---|
|
(Proposal) Submit Year (Fiscal Year) |
Day (D_DAY) Dimension |
|
Principal Investigator |
Grants Management Principal Investigator (D_GM_PI) Dimension |
|
Department |
Department (D_DEPT) Dimension |
|
Proposal ID |
Proposal Award Summary (F_GM_PRP_AWD) Fact |
|
Proposal Status |
Proposal Award Summary (F_GM_PRP_AWD) Fact Please note that the following Proposal Award Summary columns are used:
|
|
(Proposal) Description |
Grants Management Proposals (D_GM_PRP) Dimension |
|
Sponsor Amount |
Proposal Award Summary (F_GM_PRP_AWD) Fact |
|
Institution Cost Share Amount |
Proposal Award Summary (F_GM_PRP_AWD) Fact |
|
Total Budget Amount |
Proposal Award Summary (F_GM_PRP_AWD) Fact |
Submitted Proposal Count Trend Report
Use the Submitted Proposal Count Trend report, which enables you to analyze the total number of proposals submitted for a given fiscal year and quarter.
Image: Submitted Proposal Count Trend report
This example illustrates the fields and controls on the Submitted Proposal Count Trend report. You can find definitions for the fields and controls later on this page.
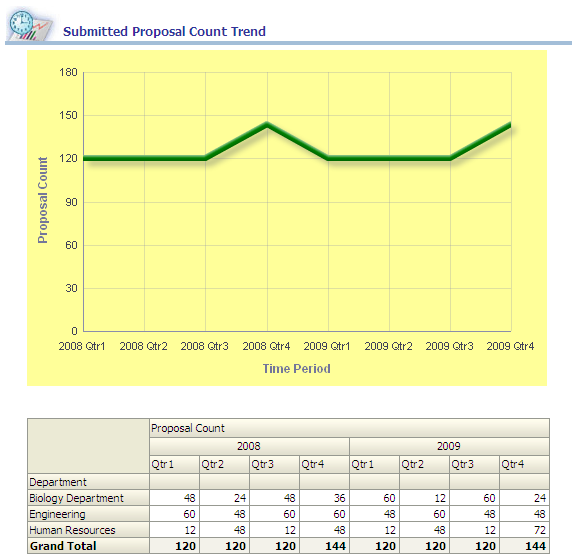
The Submitted Proposal Count Trend graph displays Time Period (Fiscal Year, Fiscal Quarter) data on the x-axis and Proposal Count data on the y-axis.
|
Report Column / Measure Name |
Report Column / Measure Origin |
|---|---|
|
Department |
Department (D_DEPT) Dimension |
|
Proposal Count |
Proposal Award Summary (F_GM_PRP_AWD) Fact |
|
Time Period (Fiscal Year) |
Day (D_DAY) Dimension |
|
Time Period (Fiscal Quarter) |
Day (D_DAY) Dimension |
Submitted Proposal Amount Trend Report
Use the Submitted Proposal Amount Trend report, which enables you to analyze the total sponsor amount submitted for a given fiscal year and quarter.
Image: Submitted Proposal Amount Trend report
This example illustrates the fields and controls on the Submitted Proposal Amount Trend report. You can find definitions for the fields and controls later on this page.
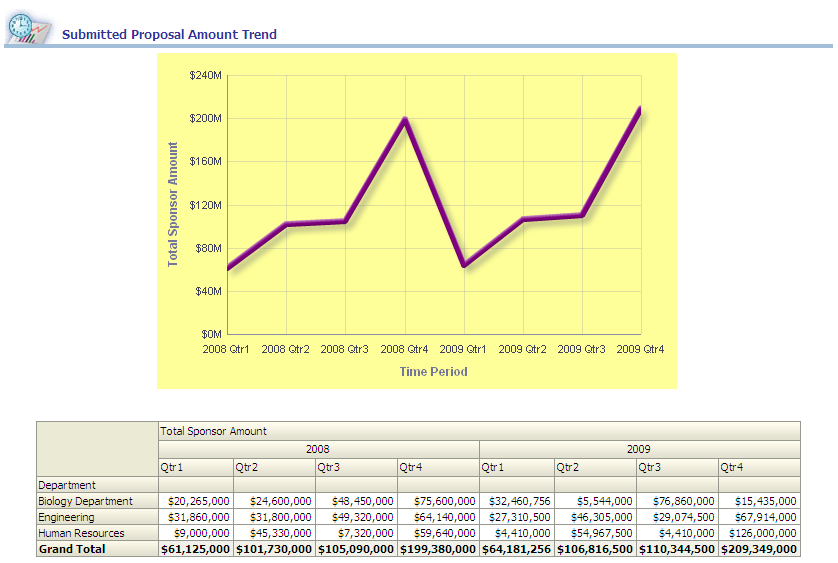
The Submitted Proposal Amount Trend graph displays Time Period (Fiscal Year, Fiscal Quarter) data on the x-axis and Total Sponsor Amount data on the y-axis.
|
Report Column / Measure Name |
Report Column / Measure Origin |
|---|---|
|
Department |
Department (D_DEPT) Dimension |
|
Total Sponsor Amount |
Proposal Award Summary (F_GM_PRP_AWD) Fact |
|
Time Period (Fiscal Year) |
Day (D_DAY) Dimension |
|
Time Period (Fiscal Quarter) |
Day (D_DAY) Dimension |